International Finance
Session 1 — The International Financial System
Laura Contreras-Portela
KEDGE Business School
September 2026
Welcome
What this course is actually about
We are going to build a set of operational models of how international financial markets work. Then we are going to spend most of our time on where they break.
- Informational efficiency, financial crises, regulation, behavioural finance — mostly through papers, not through me talking.
- The 2008–2010 crisis put risk diversification, informational efficiency and valuation efficiency in serious question. We are still living in the rewrite.
- Second objective, and I mean it: what a more responsible practice of finance would look like.
No textbook. Reference: Mishkin, F.S. & Eakins, S.G. (2008), Financial Markets and Institutions, 7th ed., Pearson.
Course description on LEARN: http://learn.kedgebs.com
Course content
| Session | Topic | Preliminary reading / assignment |
|---|---|---|
| 1–2 | International financial system | Monasterolo (2020), Climate Change and the Financial System, Ann. Rev. Resource Econ. 12 |
| 3–4 | Securities markets | Sartzetakis (2021), Green bonds as an instrument to finance low carbon transition, Econ. Change & Restructuring 54 |
| 5–6 | Financial institutions and firms | Muñoz (2020), Board of trustees, financial and sustainable performance of SRI mutual funds, CSR & Env. Mgmt 27(4) |
| 7 | Regulation | Individual assignment |
| 8 | Security analysis | Group presentation (5 students) |
| 9 | Regulation | |
| 10 | Final examination |
Read the preliminary paper before the session it is attached to. The schedule is indicative.
Evaluation
Group work — analysis of a security, groups of 5, 12-minute presentation.
Final exam — individual, written. Documents allowed.
A calculator is required for most sessions.
| Assignment | Group work | Final exam | |
|---|---|---|---|
| Weight | 20% | 40% | 40% |
| When | Session 7 (20 min) | Session 8 | Session 10 |
| Documents | Not allowed | Security analysis | Allowed |
Group work: security analysis
Maximum 5 students per group · 12-minute presentation.
- What are the characteristics of the security studied?
- What are the actual and expected situations for that security market?
- What is the international dimension of this market?
- What are the risks and opportunities in it?
Session 1 — where we are going
Four prices and one accounting identity. That is the whole session.
- The financial system — who saves, who borrows, and what sits in between
- The balance of payments — every euro that crosses the border, written down twice
- The interest rate — the price of money
- The exchange rate — the price of a currency, and who pays to defend it
- Discussion: Monasterolo (2020) — what climate does to all four
Before any of that, two questions for you — the slide after this one.
Two questions before we start
1 · Where do you want to work after this?
Finance or audit · Marketing · Business development · Consulting · Management · Logistics · Something else
Tick as many as apply.
2 · Which of these have you already met?
Exchange rates · Balance of payments · Interest rates and yield curves · Financial crises · Derivatives and hedging · Central banks · None of them yet
Also tick as many as apply. No wrong answer — this tells me where to slow down.
your form link
What the room said
Put the form’s /viewanalytics link in results_url to activate this slide.
Charts redraw on every refresh — reload once the last hand goes down.
1 · The financial system
Where does your salary sleep at night?
You are paid on the 28th. Part of it sits in a current account until the rent leaves. That balance does not sit still.
- Right now it is being lent to a firm buying a machine, or to a government rolling over a bond.
- You will never meet the borrower. You did not choose them.
- Somebody chose for you — a market, or a bank. That choice is section 1.
photo idea: a high-street bank branch, or the ECB tower in Frankfurt — search “bank branch facade” or “ECB Frankfurt”
1 · The financial system and the real economy
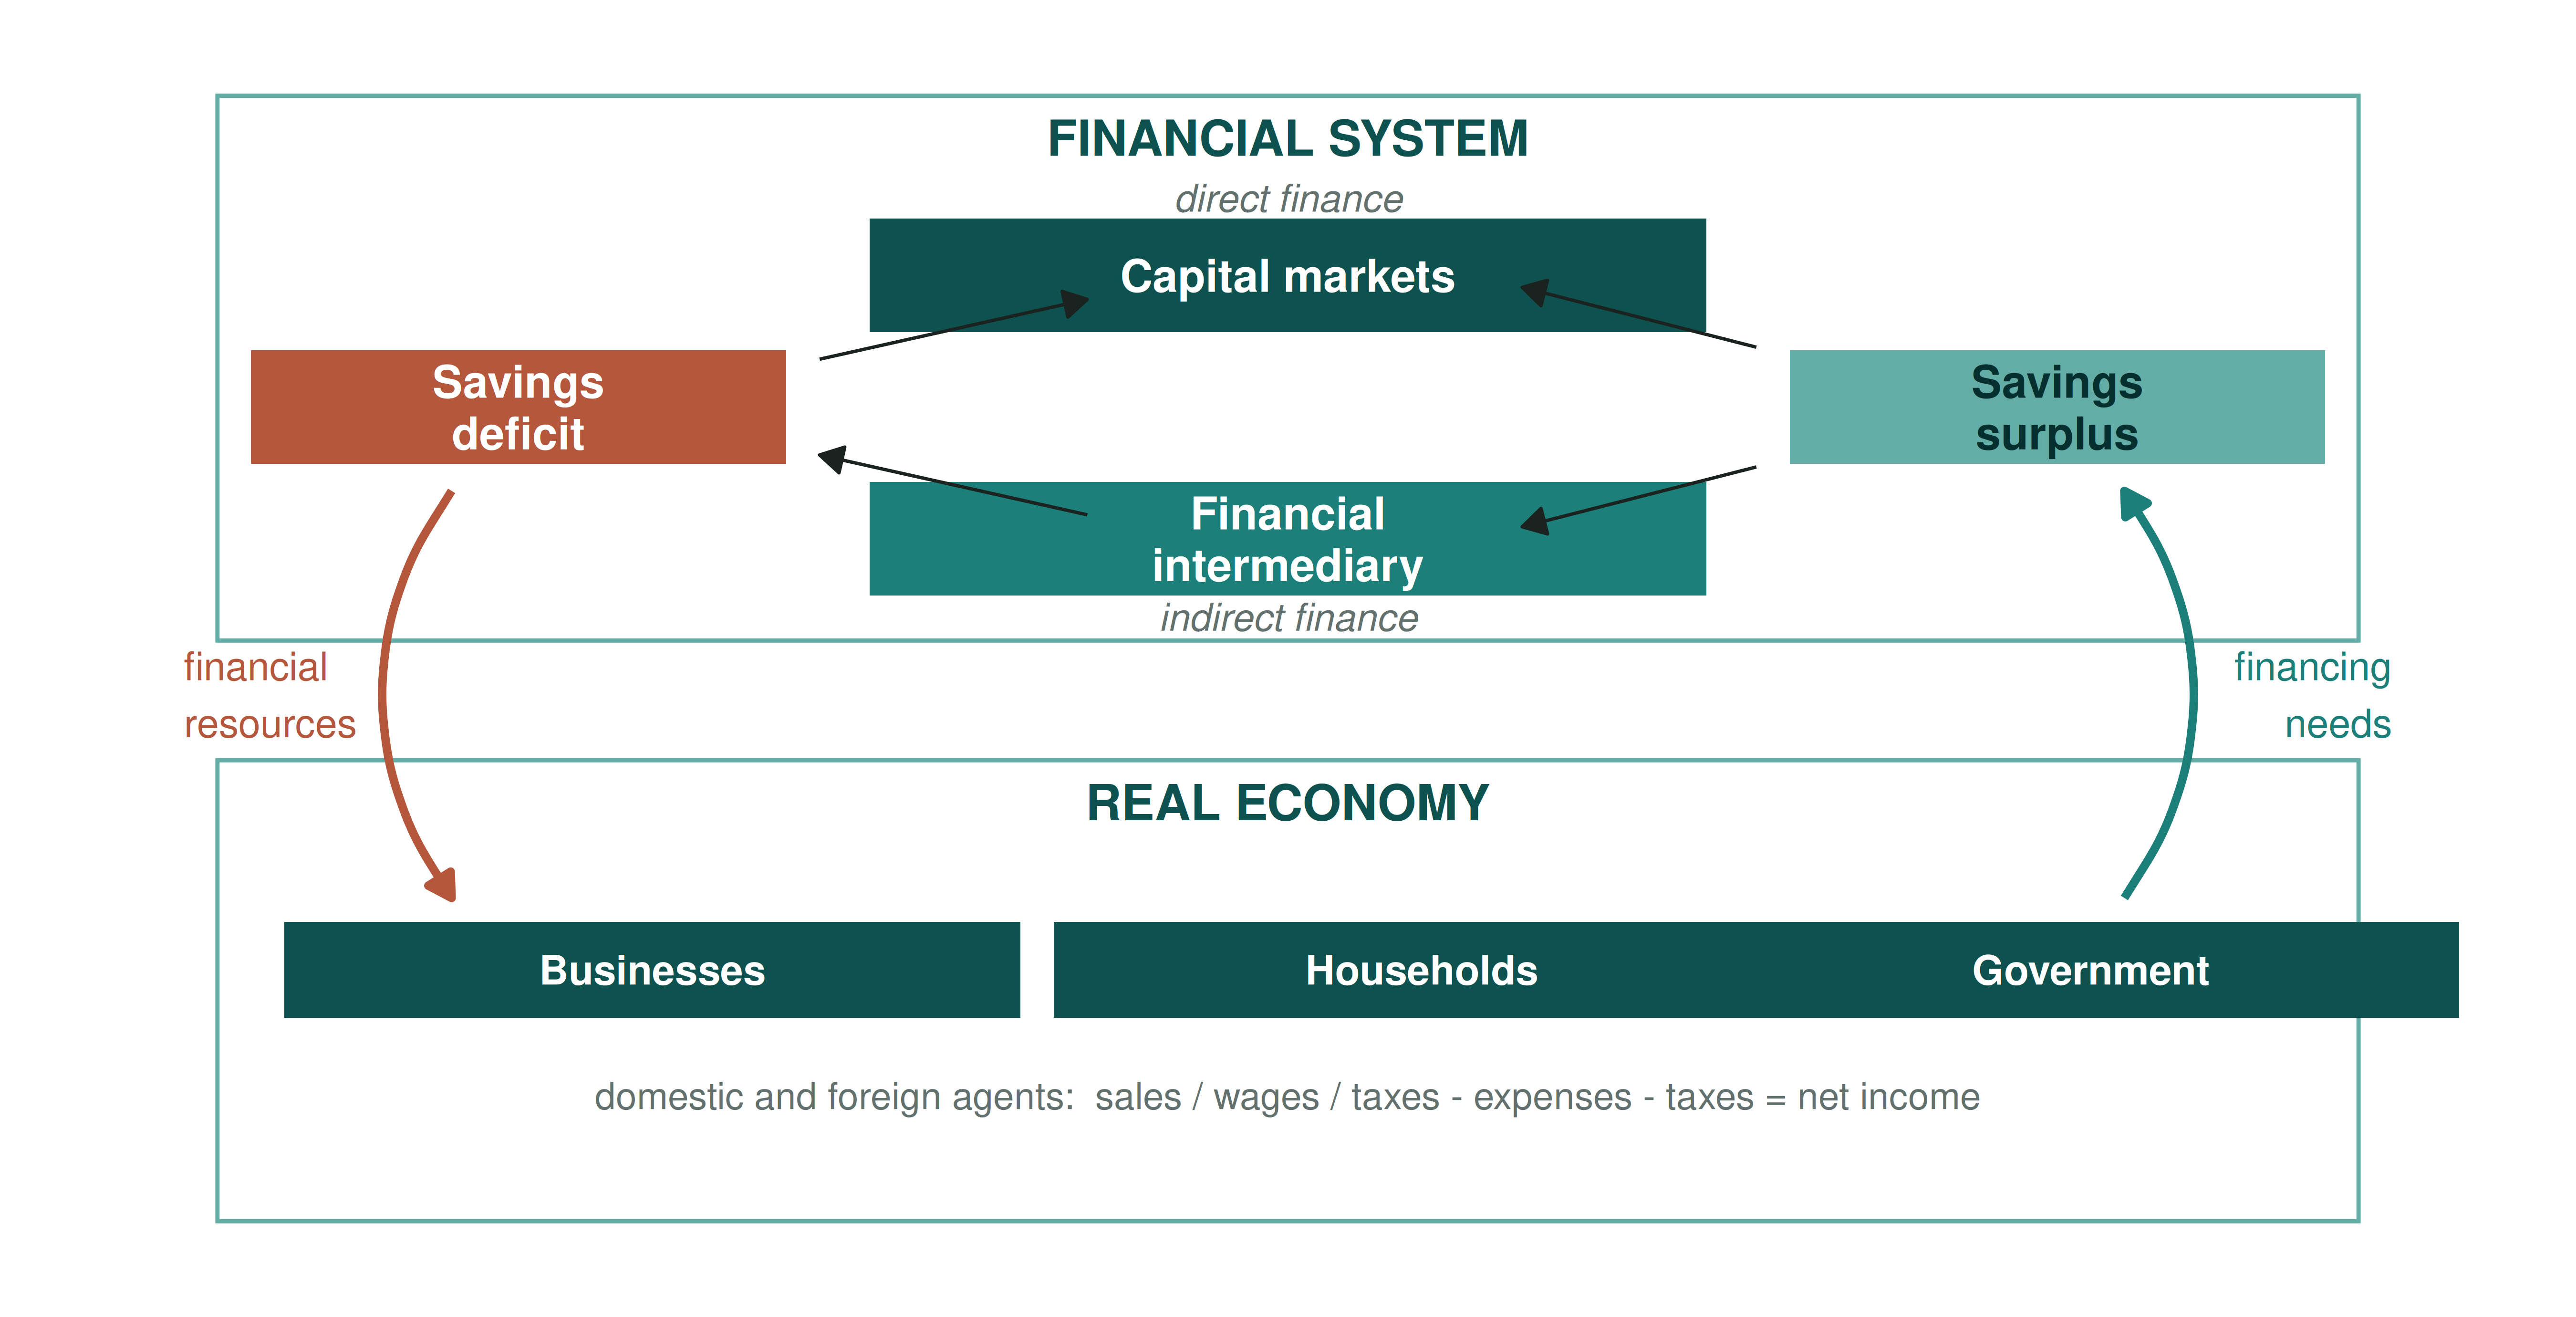
1 · Two ways of channelling savings
Market-based
Financial markets do the allocation of loanable funds. Savers hold securities directly; the price does the screening.
Bank-based
Intermediaries allocate the funds. Banks screen, monitor and transform maturity between savers and borrowers.
Germany and Japan built one; the U.S. and the U.K. built the other. What actually differs? Think competences, decision tools and information — not just who ends up holding the paper.
\text{savings} \geq \text{investment} \Rightarrow \text{savings surplus} \qquad \text{savings} \leq \text{investment} \Rightarrow \text{savings deficit}
1 · Problem 1.1 — savings by institutional sector, France
| France (EUR bn) | 2000 | 2005 | 2010 | 2015 | 2020 | 2023 | 2024 |
|---|---|---|---|---|---|---|---|
| Non-financial corporations | -2.4 | 5.7 | 24.0 | 1.5 | -3.3 | 35.0 | 37.3 |
| Financial corporations | 9.5 | 27.3 | 29.7 | 17.2 | 6.7 | -38.3 | -39.4 |
| Public administrations | -19.3 | -61.8 | -142.8 | -85.7 | -207.1 | -151.7 | -168.6 |
| Households | 40.9 | 40.8 | 82.4 | 62.7 | 155.9 | 123.5 | 168.8 |
| NPISH | 0.4 | 0.7 | 0.9 | -0.1 | 3.2 | 4.6 | 5.7 |
| Total economy | 29.0 | 12.6 | -5.7 | -4.5 | -44.6 | -27.0 | 3.8 |
Net lending (+) / net borrowing (−) by institutional sector. NPISH = non-profit institutions serving households.
(a) Which institutional sectors usually run a savings surplus, and which run a deficit?
(b) Why can France be analysed as an open economy?
Press C and annotate the table while they answer.
- Households are the structural surplus sector; public administrations the structural deficit sector.
- Non-financial corporations swing with the cycle — look at 2020 against 2024.
- The total economy line is the country’s net lending to the rest of the world. It is not zero: what closes the gap is the rest of the world.
1 · An organised architecture
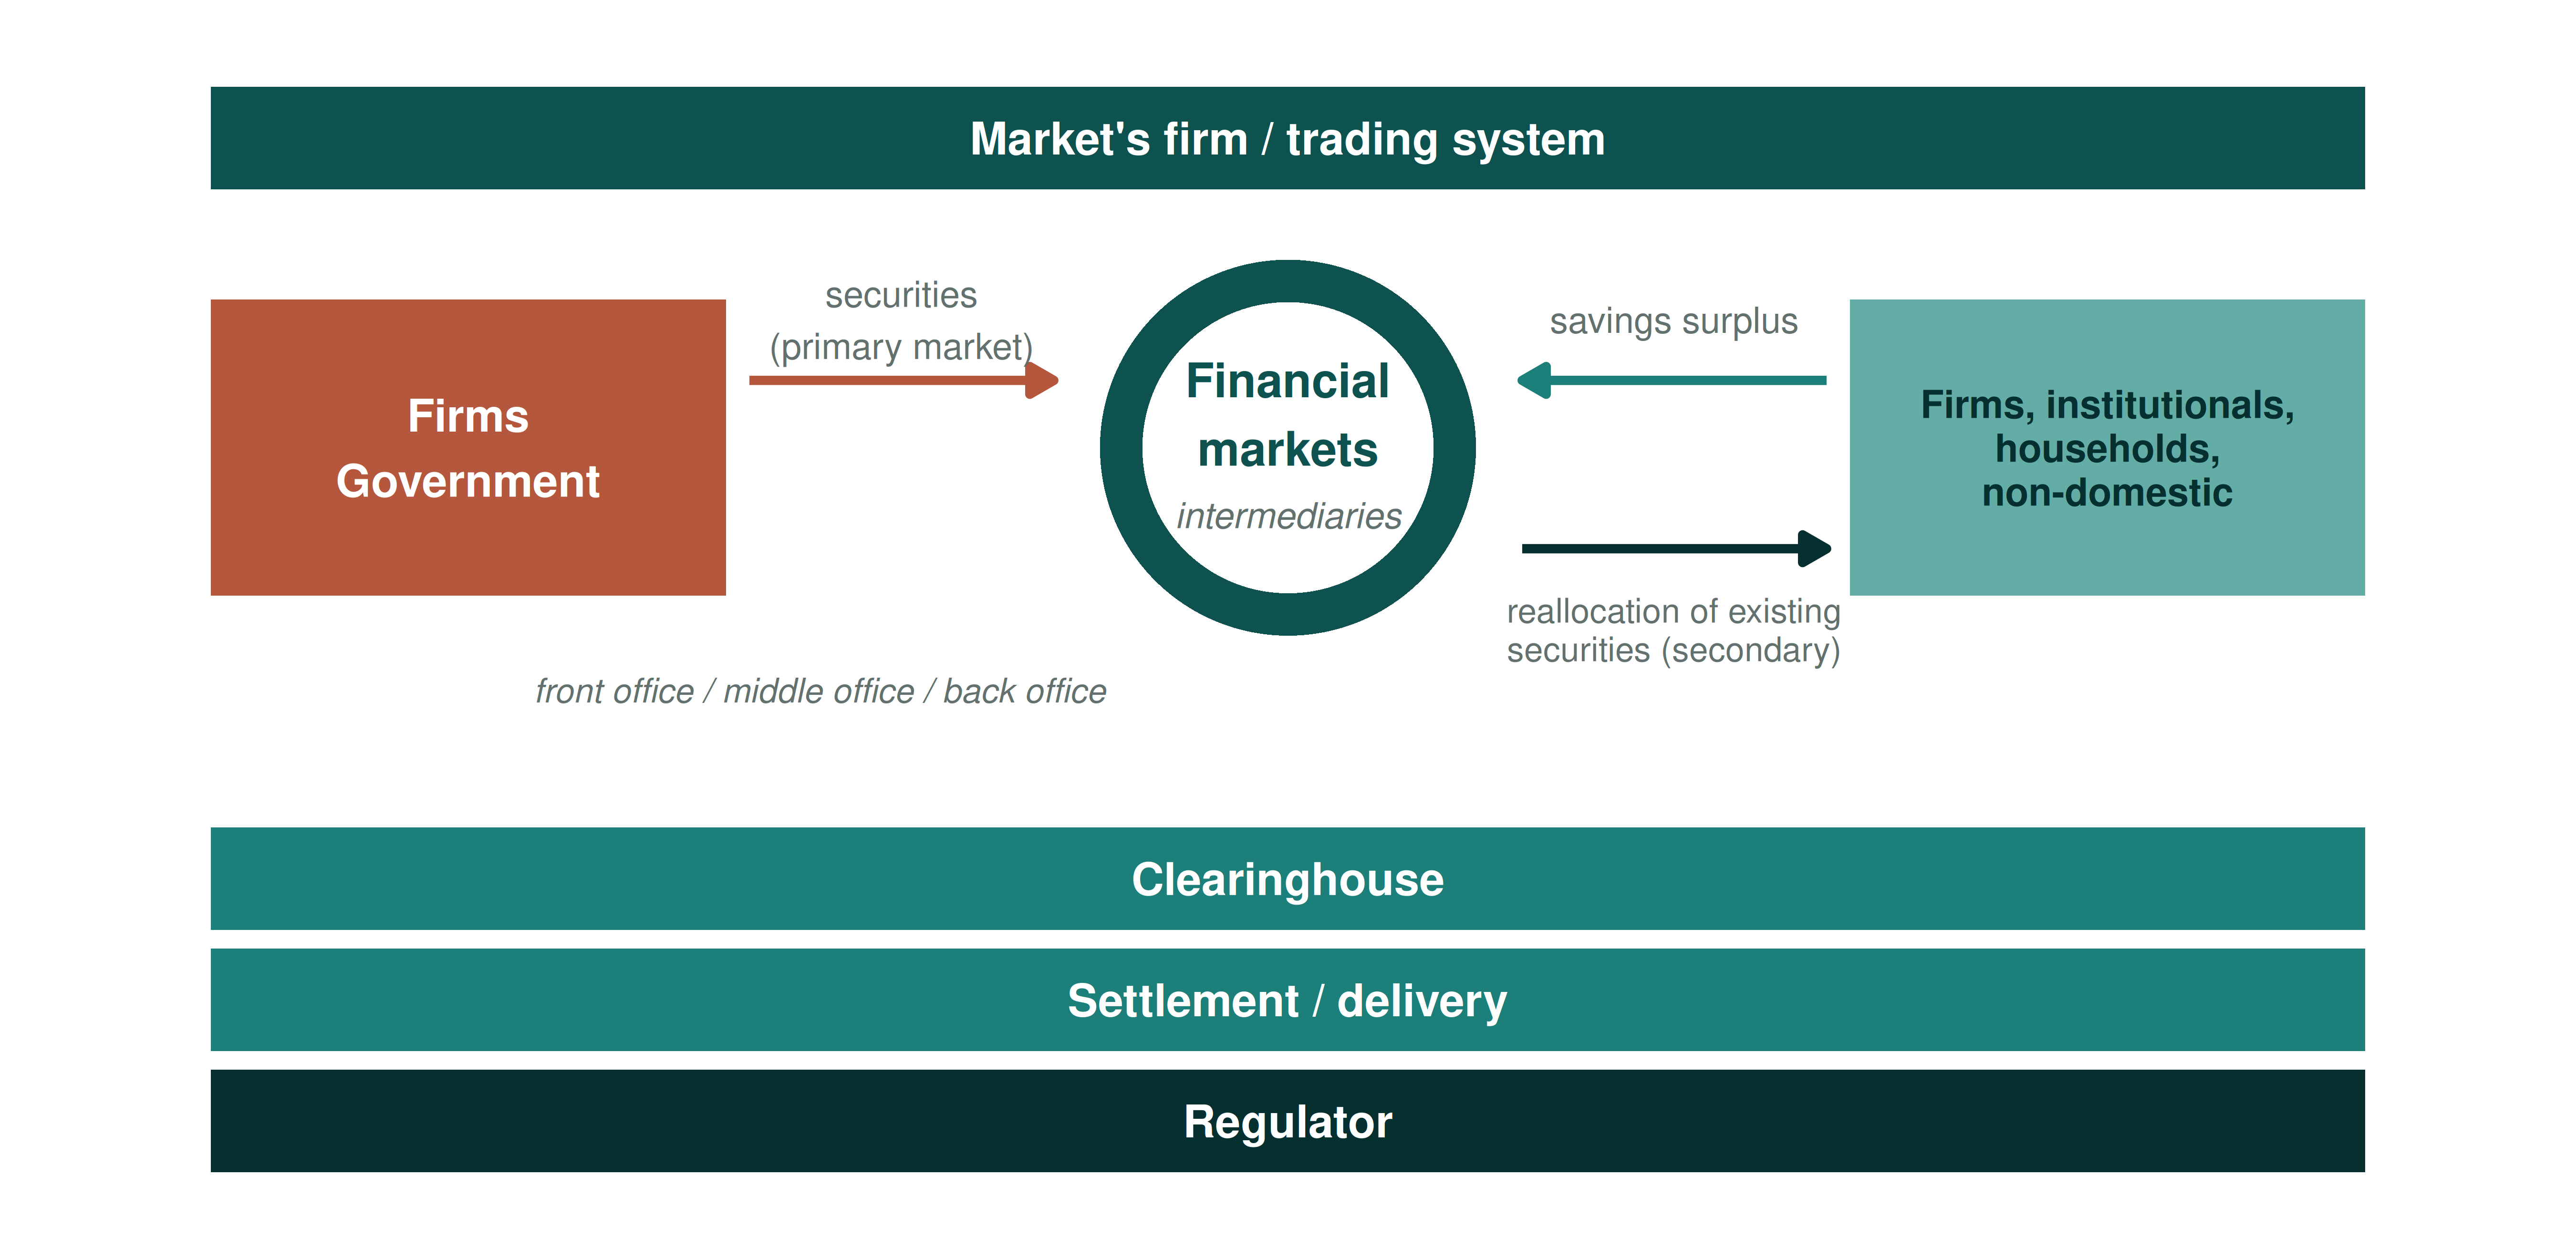
1 · The three dimensions for firms
Foreign exchange and political risk. Cross-border transactions expose firms to currency risk, and to political risk running from a change in tax rules to outright expropriation.
Market imperfections. Legal restrictions, transaction and transport costs, information asymmetry and discriminatory taxation are what motivate MNCs to locate production overseas in the first place.
Expanded opportunity set. Firms can produce anywhere and raise funds in any capital market; investors can diversify internationally.
1 · International trade
The approach
- Firms export to penetrate markets
- Firms import to obtain supplies at low cost
The firms
- Large MNCs generate a large share of sales from exporting
- Small businesses account for more than 20% of the value of all U.S. exports
Why trade rather than invest
- The firm places none of its capital at risk
- It can stay away from high-risk countries
- It can reduce or discontinue flows easily
Trade is the low-commitment way of being international. FDI is the high-commitment one — that is the choice behind most of this course.
1 · The consequences of free trade
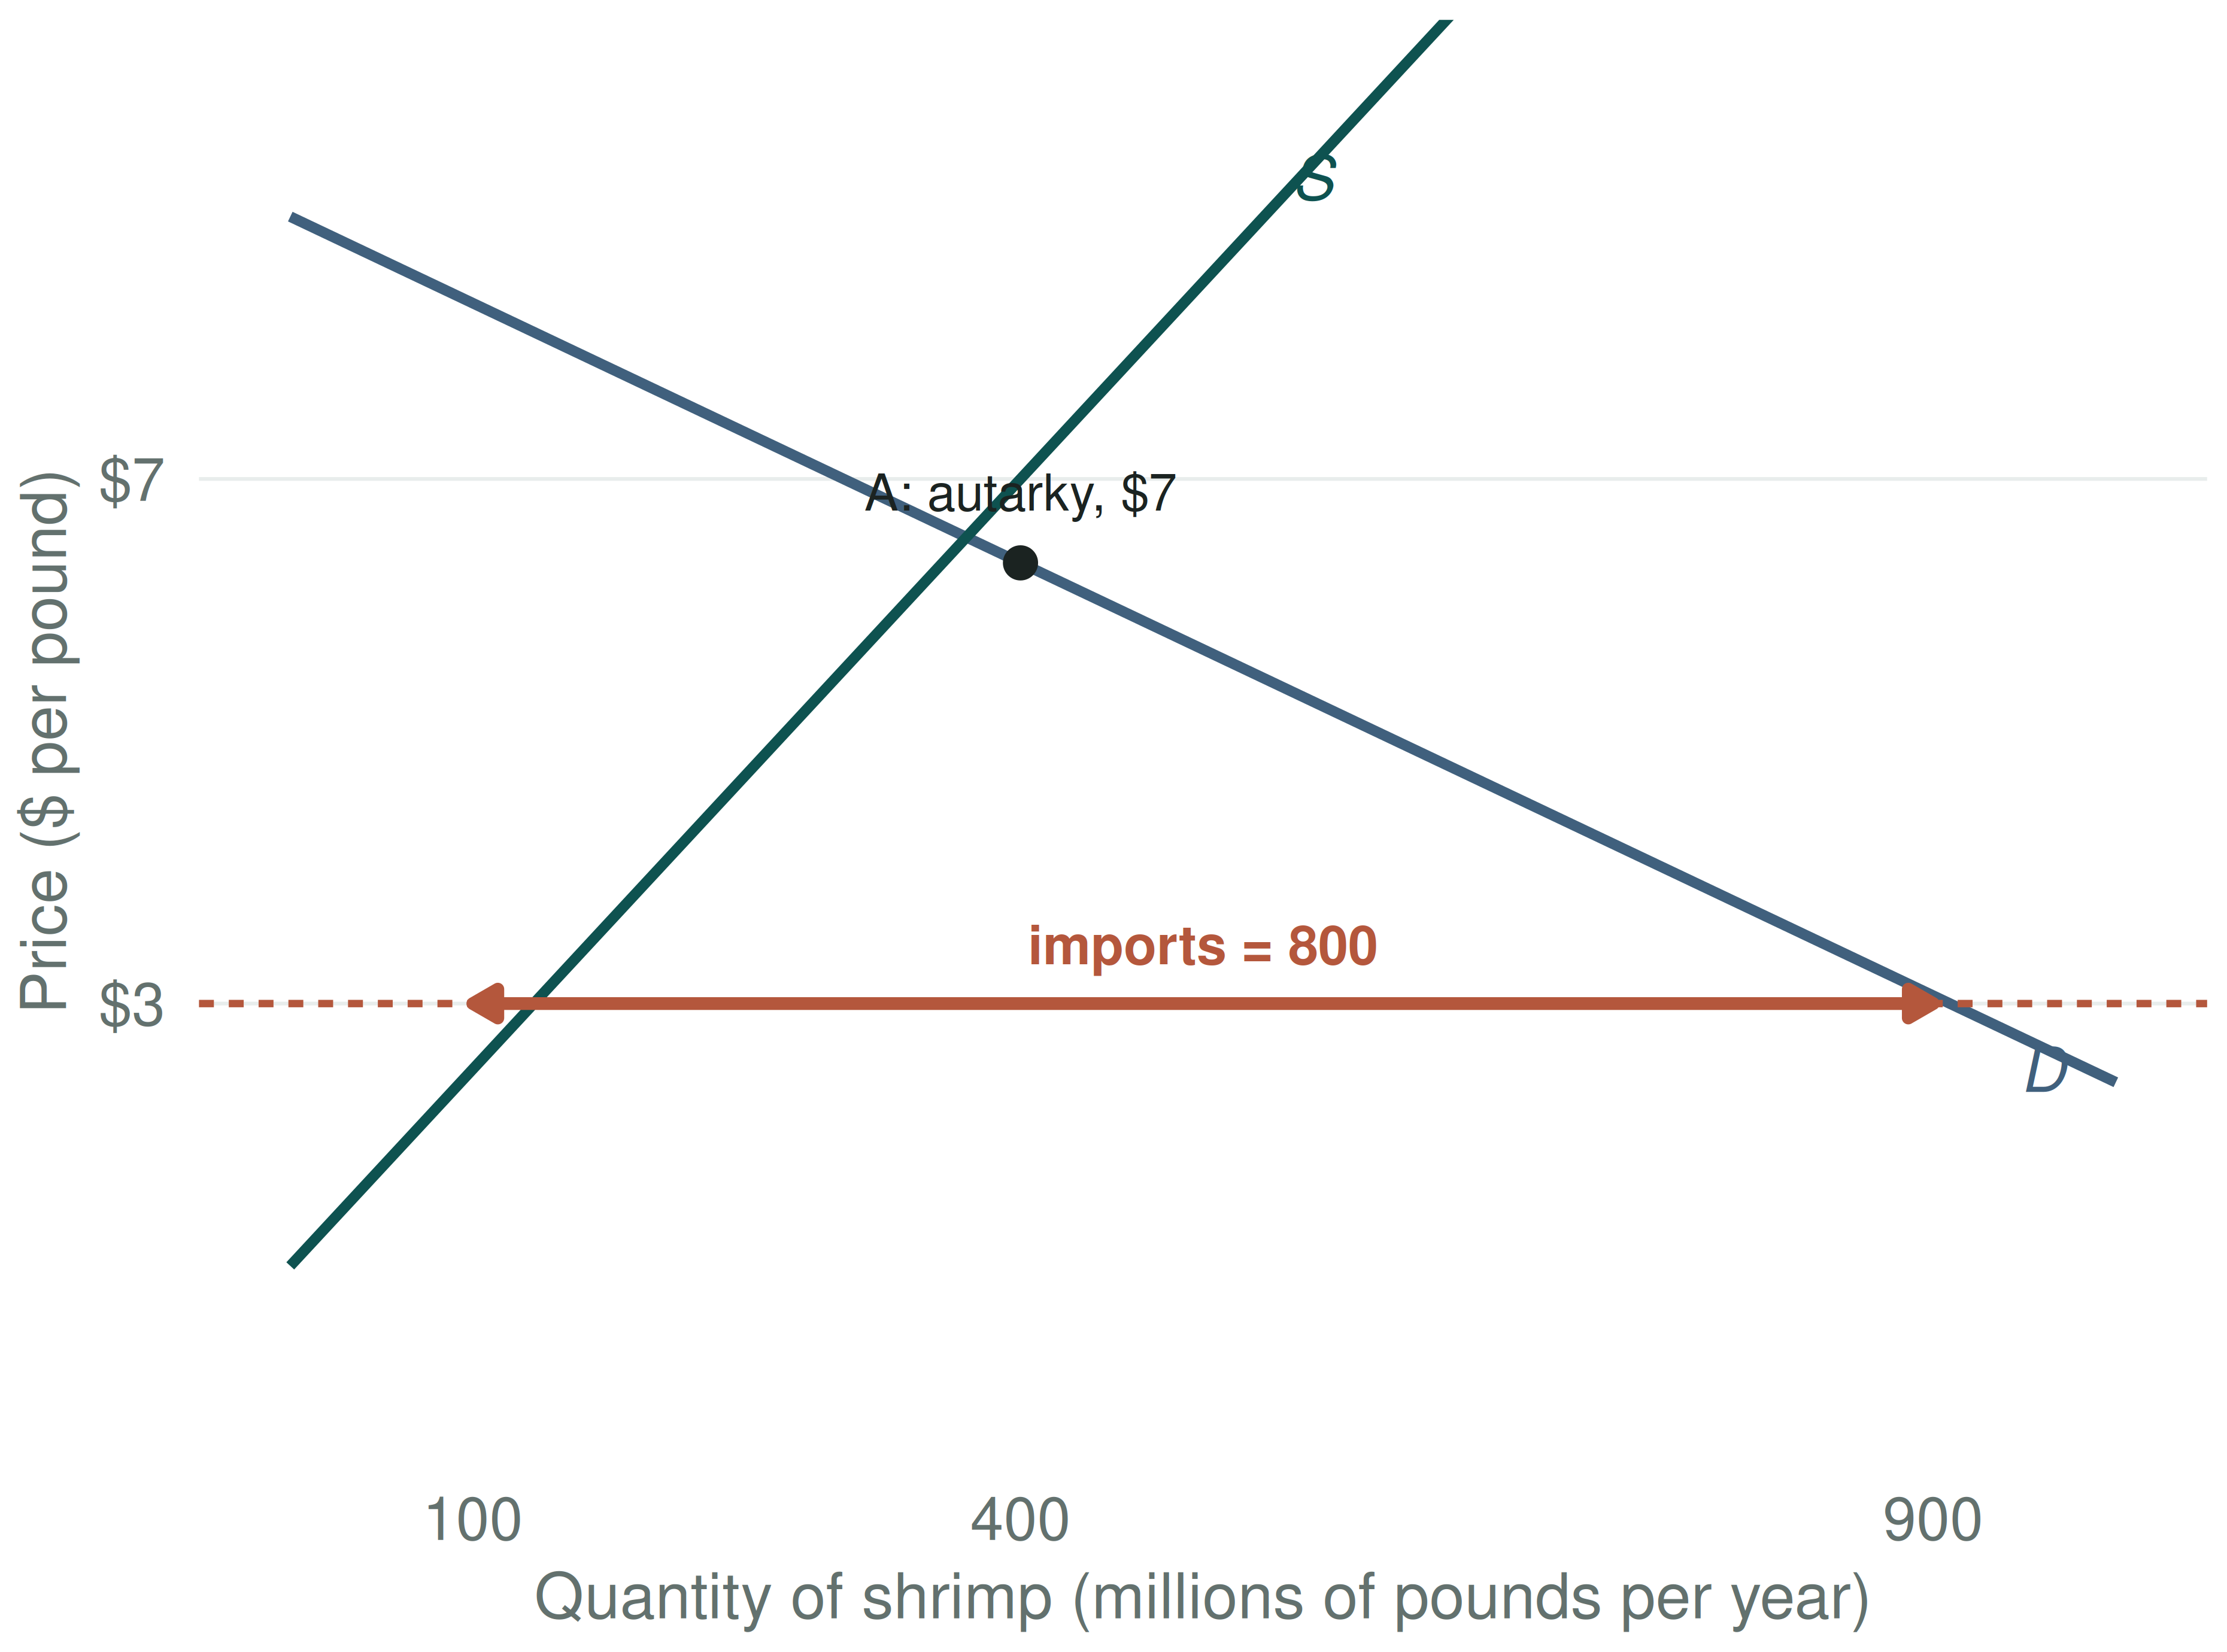
The U.S. has no comparative advantage in shrimp. At the world price of $3 rather than the autarky price of $7:
- domestic production falls to 100
- domestic consumption rises to 900
- imports fill the gap of 800
Who gains, who loses, and by how much? Careful — “the country gains” is not an answer.
1 · The policy bias
- Domestic producers want the cheap import restricted; domestic consumers would oppose it, but no individual consumer has a strong incentive to lobby.
- The benefit of protection is concentrated on those who work in or own firms in the industry. The cost is diffuse.
- Since a country has the power to restrict imports, the lobbying often succeeds.
The mirror image runs against exports: foreign producers who compete with U.S. goods complain loudest, foreign consumers who gain stay silent, and U.S. exporters are not constituents of that foreign government.
So: a bias against imports at home, and a bias against your exports abroad. Every country does this to every other country. Where does that leave a small open economy?
1 · The antidotes to the policy bias
In a bilateral or multilateral agreement, two or more countries agree to trade freely in many goods — or all goods — simultaneously. Bundling defeats the concentrated lobby, because every protected group faces every exporting group at once.
By setting standards for acceptable and unacceptable trade restrictions, and ruling in specific cases, the WTO has some power over national trade policy.
“Consumers” includes any buyer of a product — a firm using it as an input. When the good is a large part of their costs, those firms lobby for free trade.
In late 2004 the U.S. textile industry lobbied the Bush administration to slow the rise of clothing imports from China. U.S. clothing retailers and importers, for whom clothing is an input, lobbied hard against any barrier.
2 · The balance of payments
Ireland exports more than it makes
In 2024 Ireland ran a goods surplus of €177 bn and a primary income deficit of €129 bn. Money arrives for the goods and leaves again for the shareholders, most of whom live somewhere else.
- Nothing is broken. The accounts are doing exactly what they were built to do.
- A balance of payments always balances. No country has ever run out of balance — they run out of reserves, which is a different thing entirely.
- Section 2 is learning to read the table well enough to see the story inside it.
2 · The basics
A country’s transactions with the rest of the world, recorded over a period, in order to
- give information on the demand for and supply of a country’s currency
- signal the country’s potential as a business partner
- evaluate its performance in international economic competition
Every credit is matched by a debit. A receipt from foreigners is a credit (+) and creates demand for your home currency. A payment to foreigners is a debit (−) and creates demand for the foreign currency, i.e. supply of yours.
2 · The current account, BCA
- Merchandise trade — exports and imports of tangible goods. Its balance is the trade balance.
- Services — legal, consulting and engineering services, royalties for patents and IP, insurance premiums, shipping fees, tourist expenditure. Trade in intangibles: invisible trade.
- Factor income — interest, dividends and other income on foreign investments previously made.
- Unilateral transfers — foreign aid, reparations, official and private grants, gifts. Unlike the rest, these flows are one-directional.
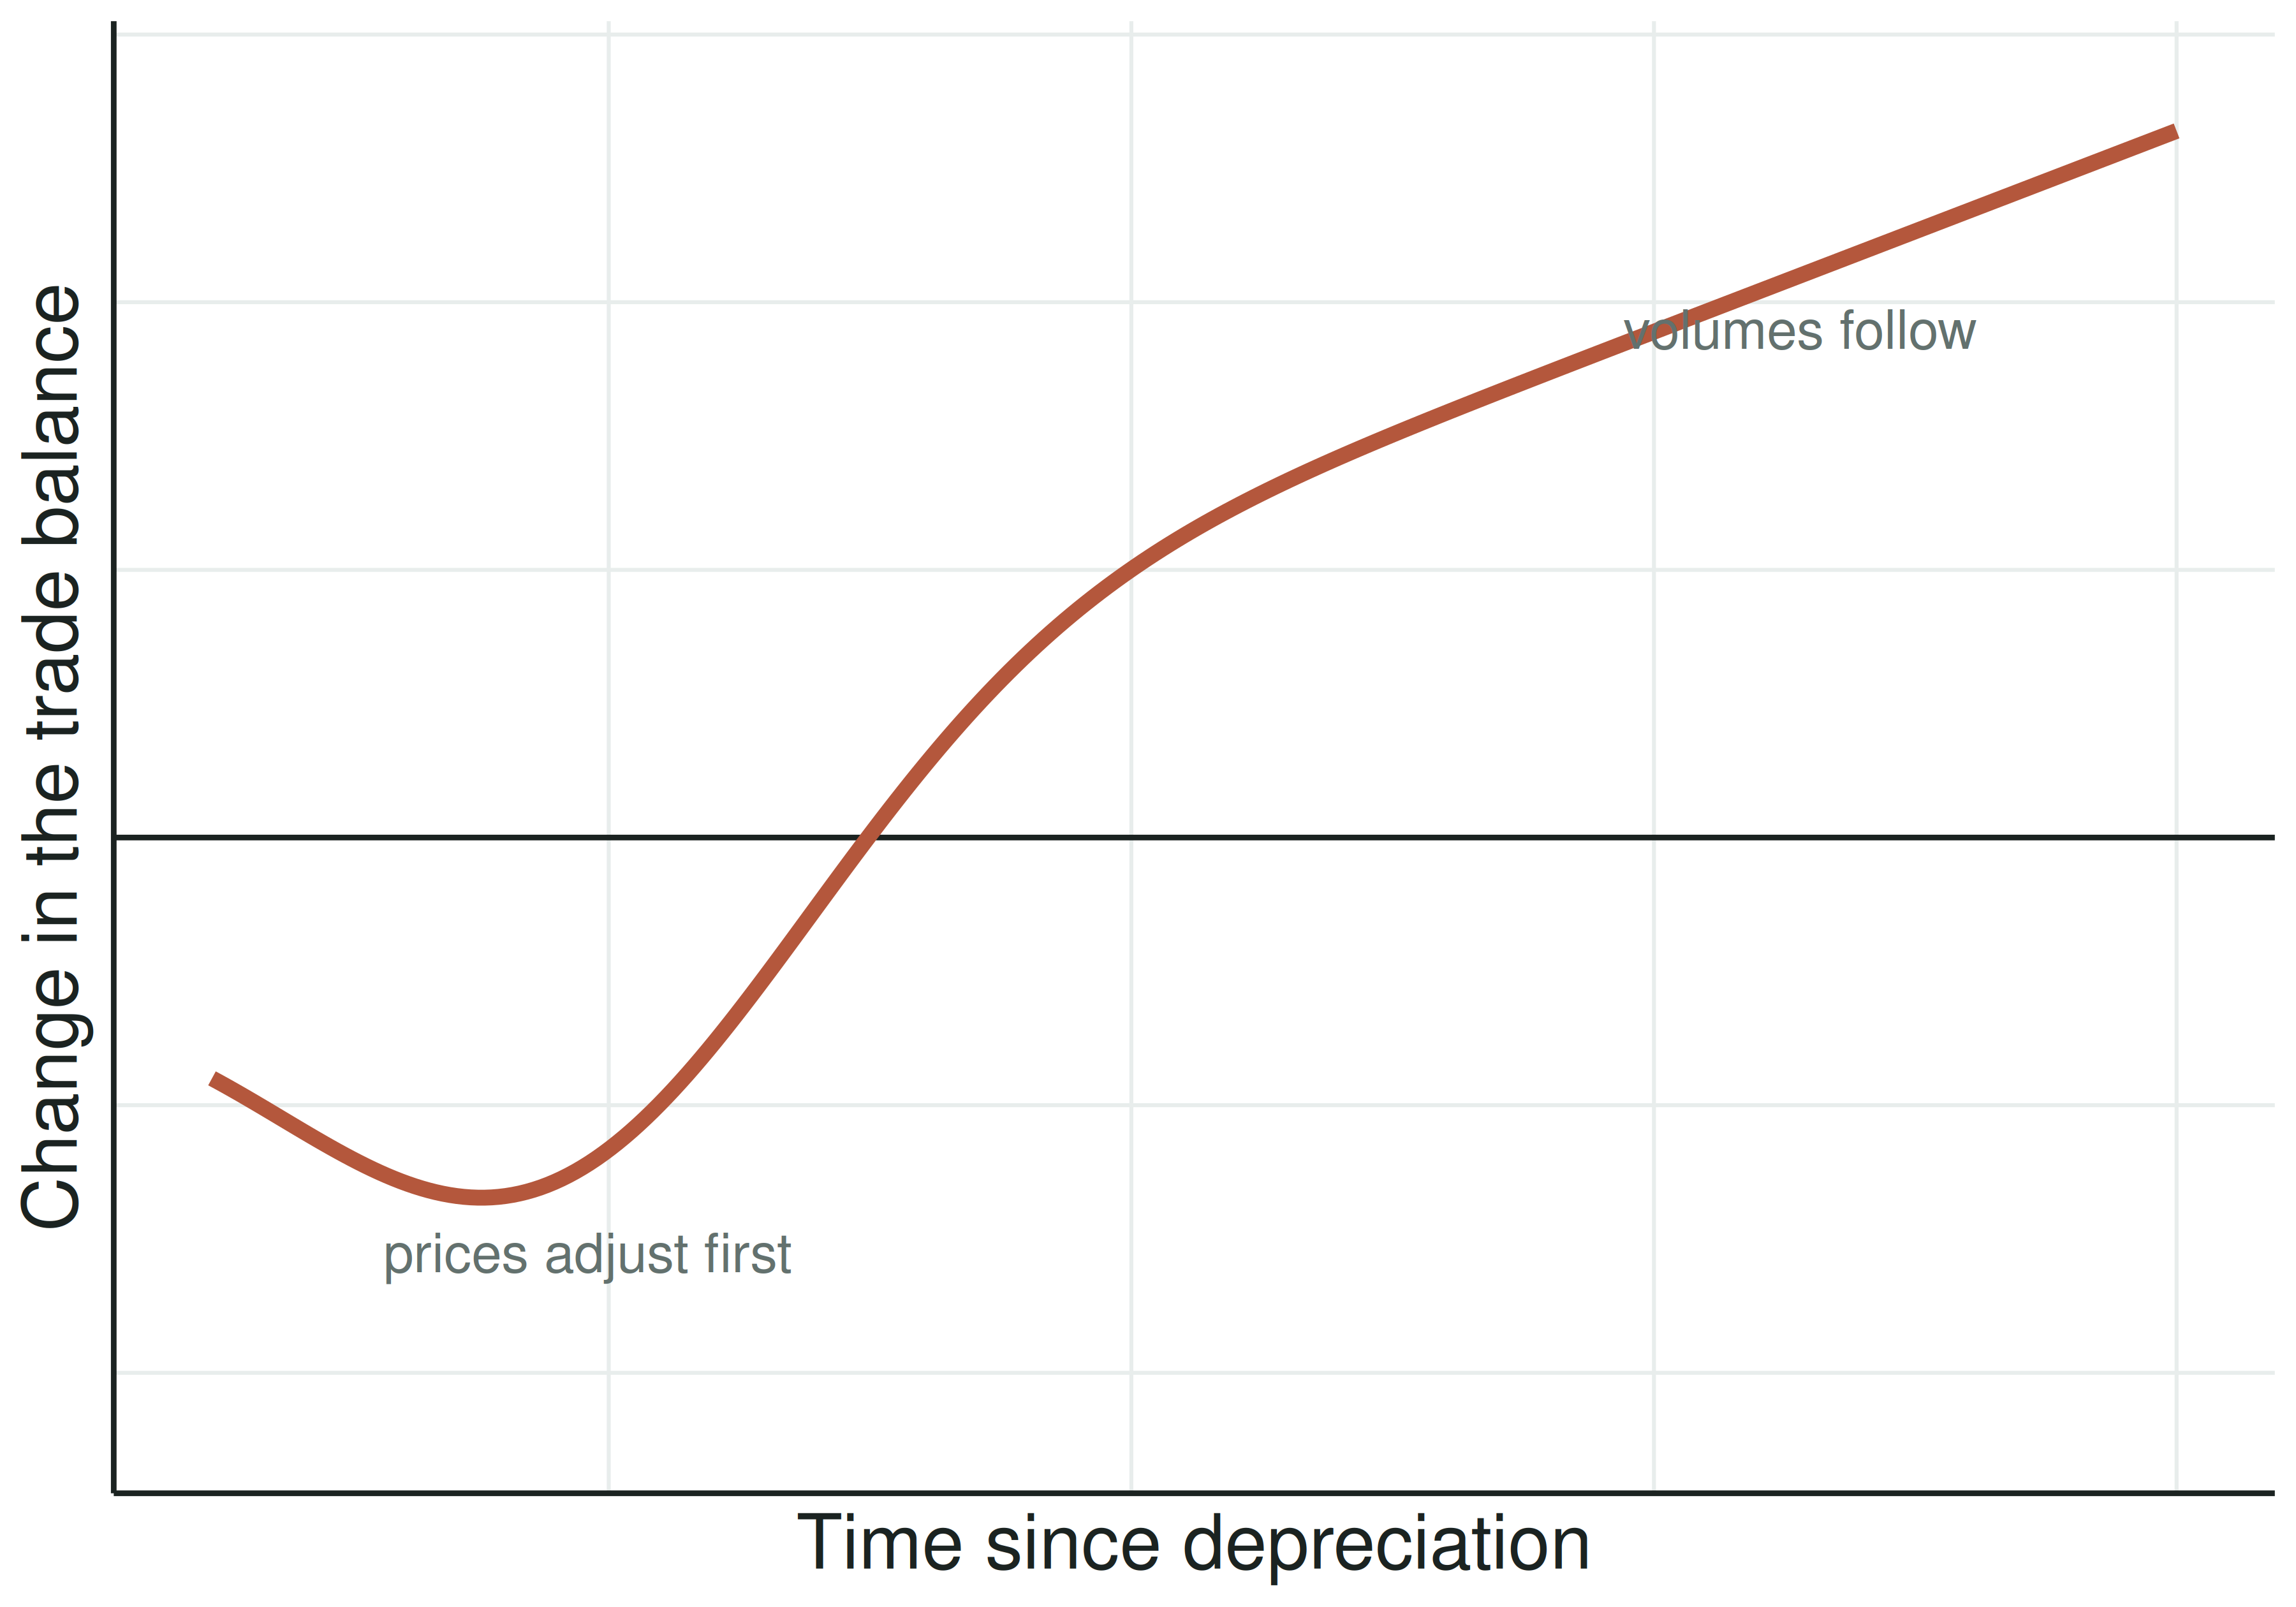
2 · The J-curve
Following a depreciation the trade balance may first deteriorate and only then improve.
- Import prices rise immediately; volumes adjust slowly, because consumption habits are sticky.
- The shape depends on the elasticities of imports and exports.
- Marshall–Lerner: the balance improves only once |\varepsilon_x| + |\varepsilon_m| > 1.
2 · The financial and capital account, BKA
- Capital account — transactions in non-financial, non-produced assets.
- Foreign direct investment — firms exploiting market imperfections such as under-priced labour and protected markets. In the U.S. accounts, acquiring 10% or more of the voting shares counts as direct investment.
- Portfolio investment — sale and purchase of financial assets without transfer of control; boomed with the relaxation of capital controls and the desire to diversify risk.
- Financial derivatives — options, futures and swaps used for hedging.
- Other investment — currency, bank deposits, trade credits.
- Statistical discrepancy — omitted and misrecorded transactions.
2 · The official reserve account, BRA, and the identity
The overall balance indicates the international payment gap that must be compensated by official reserve transactions.
Deficit — the central bank runs down official reserve assets (gold, foreign exchange) or borrows from foreign central banks.
Surplus — it retires foreign debt or acquires reserve assets from foreigners.
BCA + BKA + BRA = 0
Pure float, no intervention: BCA = -BKA
Fixed regime, BCA+BKA \neq 0: BCA + BKA = -BRA
2 · Problem 1.2 — the balance of payments of France
| Balance of payments (EUR m) | 2021 credits | 2021 debits | 2021 balance | 2022 credits | 2022 debits | 2022 balance |
|---|---|---|---|---|---|---|
| 1. Current account | 1 217 059 | 1 207 192 | 9 867 | 1 305 182 | 1 361 853 | -56 671 |
| 1.1. Goods | 622 099 | 701 546 | -79 447 | 669 608 | 813 875 | -144 267 |
| 1.2. Services | 303 452 | 262 453 | 40 999 | 343 419 | 288 781 | 54 638 |
| 1.3. Income | 236 992 | 139 916 | 97 076 | 245 451 | 164 373 | 81 078 |
| 1.4. Current transfers | 54 516 | 103 277 | -48 761 | 46 704 | 94 824 | -48 120 |
| 2. Capital account | 11 819 | 485 | 11 334 | 12 510 | 1 196 | 11 314 |
| 3. Financial account | 570 363 | 592 038 | -21 675 | 646 671 | 708 366 | -61 695 |
| 3.1. Direct investment | 108 891 | 95 865 | 13 026 | 118 759 | 105 425 | 13 334 |
| 3.2. Portfolio investment | 144 062 | 122 206 | 21 856 | 35 326 | 155 737 | -120 411 |
| 3.3. Financial derivatives | 152 737 | 132 013 | 20 724 | 248 775 | 291 755 | -42 980 |
| 3.4. Other investment | 164 673 | 241 954 | -77 281 | 243 811 | 155 449 | 88 362 |
| 4. Net errors and omissions | -15 866 | -14 661 | ||||
| 5. Reserve assets | 27 009 | 27 009 | 1 677 | 1 677 |
(a) What is your analysis of the French balance of payments?
(b) Does the balance of payments identity hold for France?
- Assets: residents’ transactions in securities issued by non-residents
- Liabilities: non-residents’ transactions in securities issued by residents
- The current account turns from +9.9 bn in 2021 to −56.7 bn in 2022 — and goods alone go from −79 to −144 bn. Energy prices.
- Services and income are the two structural surpluses. They fund part, not all, of the goods deficit.
- Add the accounts including net errors and omissions and reserve assets before deciding whether the identity holds.
2 · Europe in 2024 — current and capital account
| Country | Current account | Goods | Services | Primary income | Secondary income | Capital account |
|---|---|---|---|---|---|---|
| EU | 493.5 | 384.1 | 191.1 | 28.4 | -110.4 | -34.9 |
| Euro area | 425.9 | 371.9 | 169.0 | 53.6 | -168.5 | 6.3 |
| Germany | 246.7 | 235.5 | -74.0 | 149.0 | -63.8 | -20.4 |
| France | 11.6 | -58.1 | 55.1 | 61.8 | -47.2 | 5.9 |
| Italy | 24.8 | 64.0 | -7.0 | -15.8 | -16.4 | -0.6 |
| Spain | 48.1 | -32.3 | 100.4 | -8.1 | -11.8 | 18.5 |
| Netherlands | 112.7 | 99.0 | 38.2 | -15.8 | -8.6 | -3.4 |
| Ireland | 91.5 | 176.6 | 48.5 | -129.0 | -4.6 | -18.2 |
| Poland | 1.7 | -6.4 | 40.2 | -28.5 | -3.7 | 2.3 |
Ireland’s primary income is −129 bn against a goods surplus of +177 bn. What kind of firm produces that pattern?
€ billion. Selected economies. Source: Eurostat, Main components of the current account balance and the capital account balance, 2024 — full table for all reporting countries
2 · Europe in 2024 — the financial account
| Country | Financial account, net | Direct inv., assets | Direct inv., liab. | Portfolio inv., assets | Portfolio inv., liab. | Reserve assets |
|---|---|---|---|---|---|---|
| EU | 591.6 | 190.4 | -117.9 | 641.9 | 769.6 | 45.5 |
| Euro area | 491.8 | 196.5 | -49.1 | 734.0 | 848.4 | 4.6 |
| Germany | 239.4 | 73.8 | 43.4 | 219.8 | 188.4 | -1.4 |
| France | -21.9 | 43.5 | 51.6 | 240.9 | 259.9 | 1.4 |
| Italy | 51.0 | 31.5 | 20.1 | 93.2 | 166.9 | 2.1 |
| Spain | 69.8 | 48.4 | 29.8 | 90.7 | 87.8 | 1.3 |
| Netherlands | 105.8 | 11.2 | -13.0 | 64.3 | 4.9 | -0.7 |
| Ireland | 83.1 | 62.7 | 3.7 | 443.6 | 391.5 | -0.1 |
| Poland | -6.3 | 7.2 | 17.0 | 13.4 | 23.7 | 27.2 |
€ billion. Selected economies. Source: Eurostat, Main components of the financial account balance with the rest of the world, 2024.
3 · The interest rate
The week a number moved a pension fund
September 2022, the UK. Gilt yields jumped after the mini-budget. Pension funds running leveraged liability-driven strategies got collateral calls, sold gilts to meet them, and pushed yields higher still. The Bank of England had to step in and buy.
- Nobody’s view of the British economy changed that fast. The price of money did.
- An interest rate is not a number on a screen. It is the price that reprices everything you own.
3 · Supply and demand for loanable funds
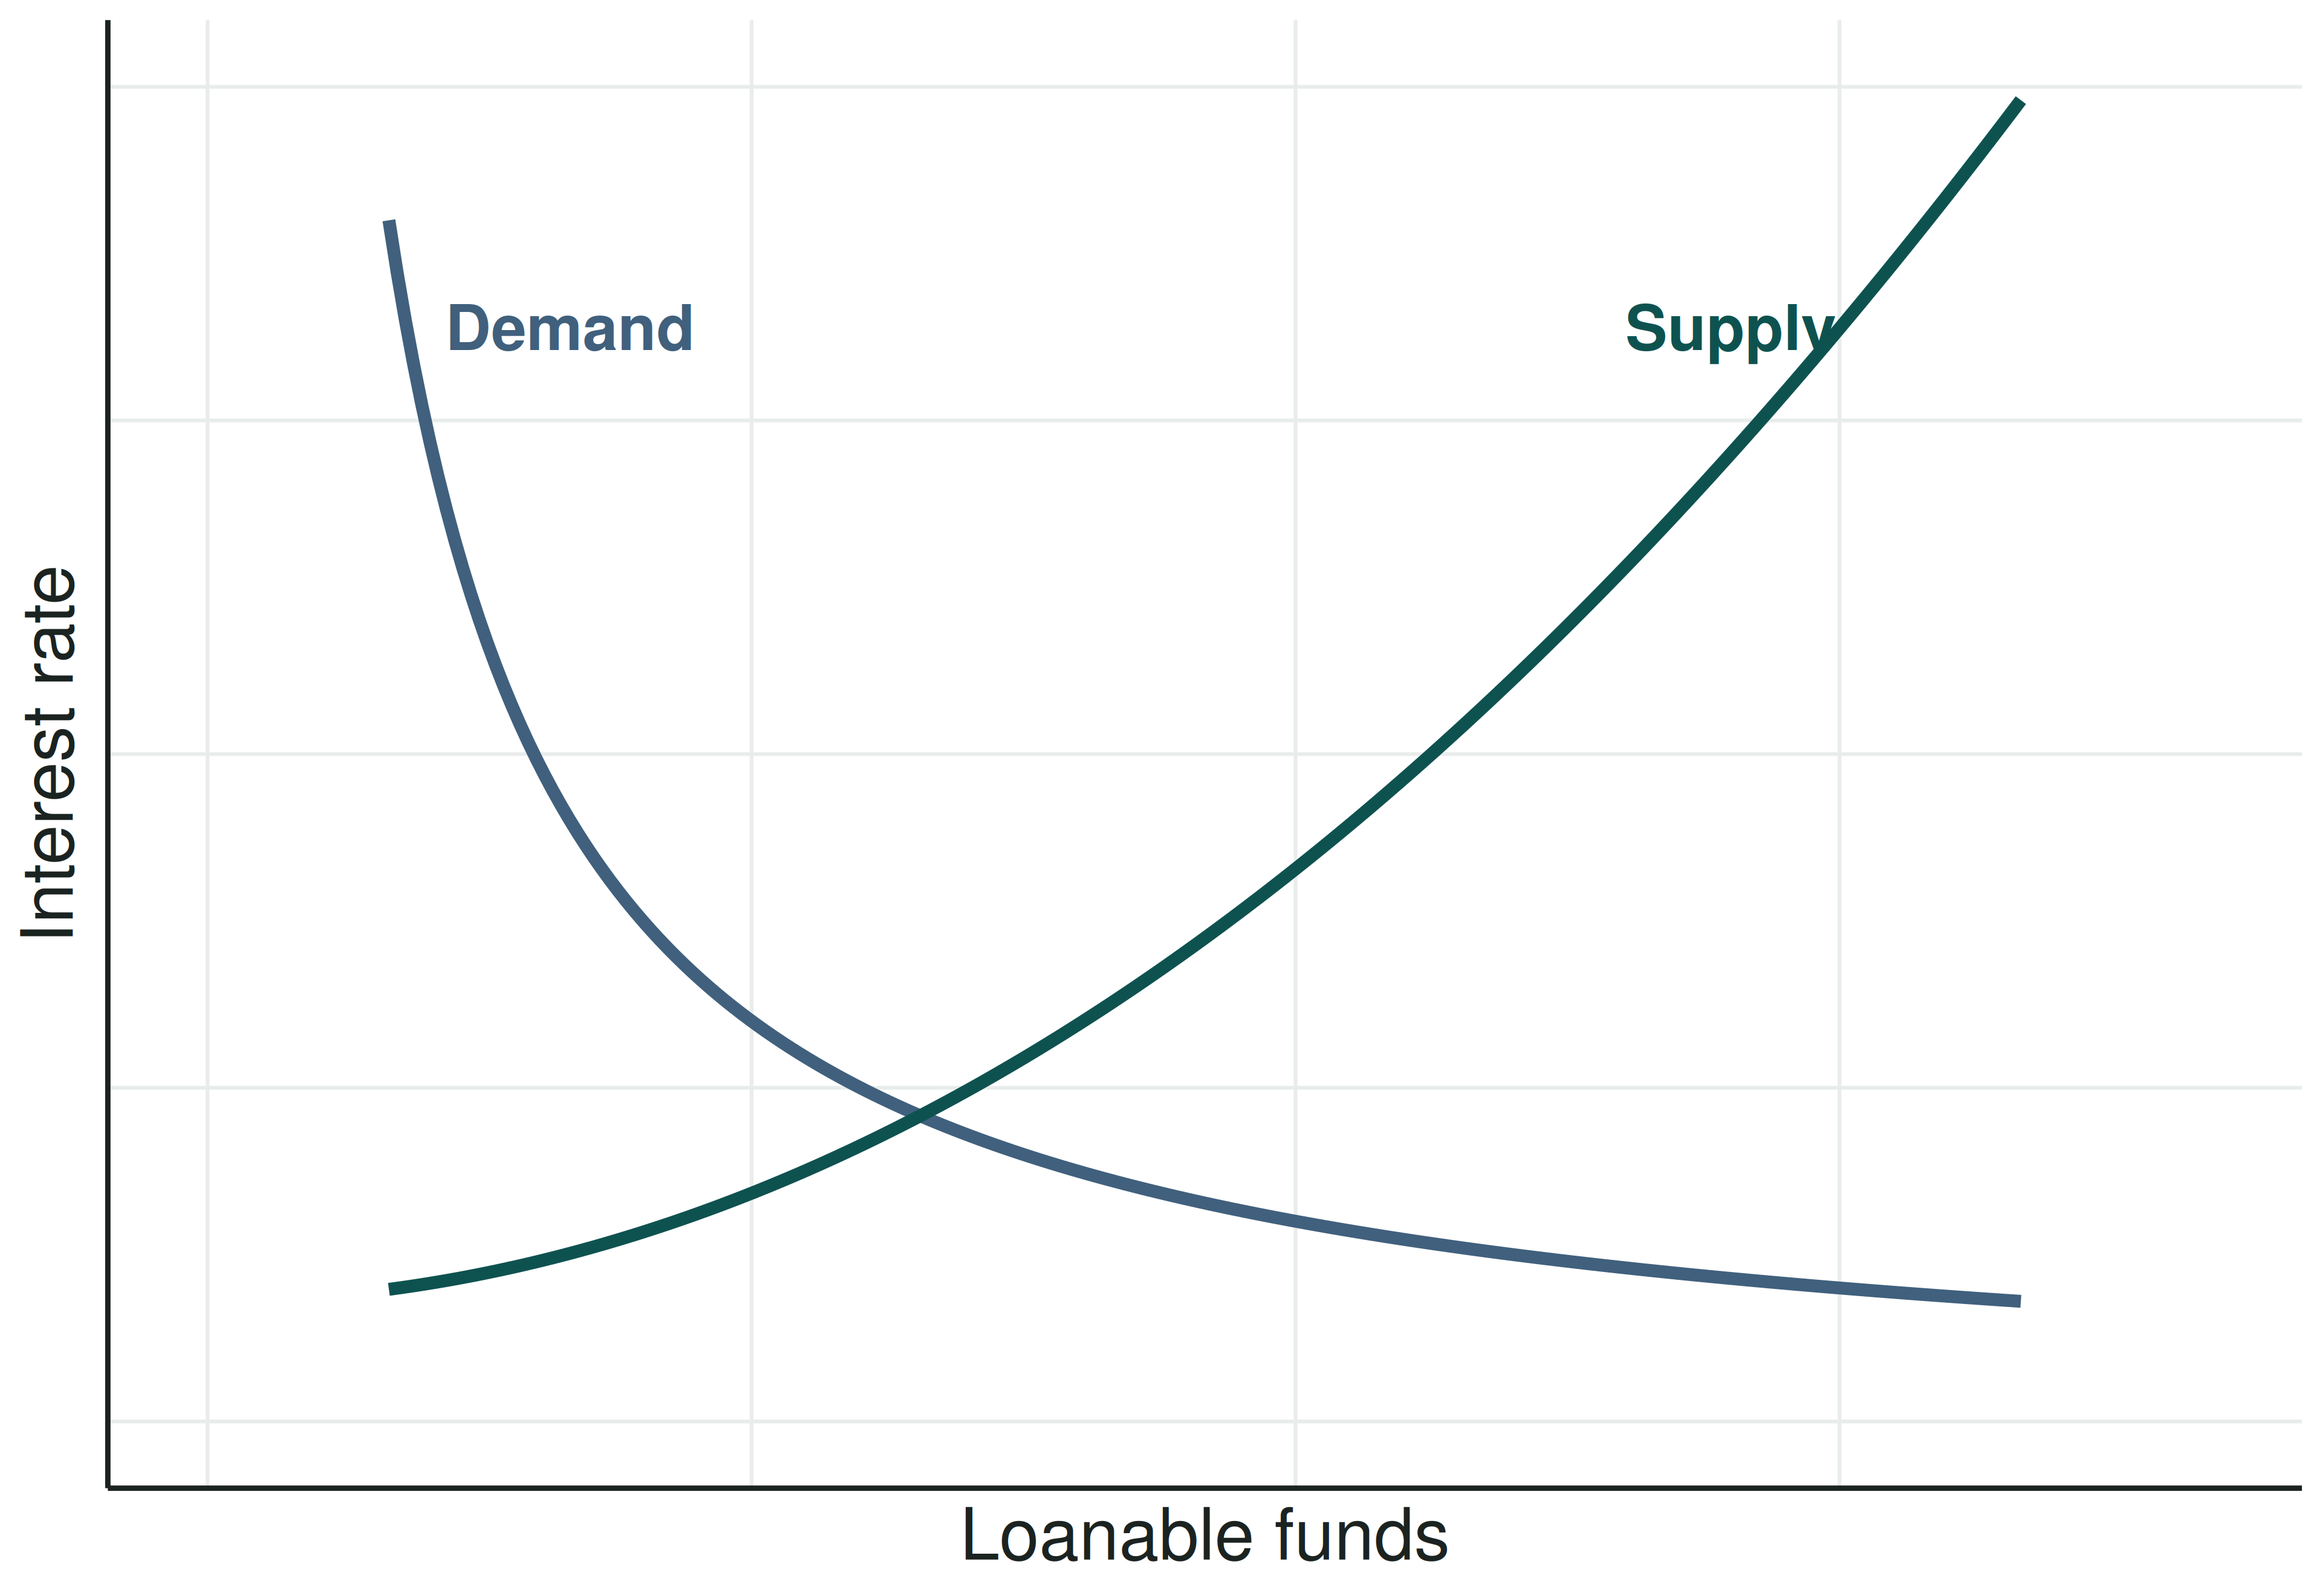
The interest rate is the price that clears the market for loanable funds.
Everything in the next two slides is a shift of one of these two curves. Ask yourself which one, and in which direction.
3 · What shifts the supply of funds
- Wealth of fund suppliers rises (households, businesses) → more available for investment
- Risk of the security falls — lower probability of issuer default → securities more attractive to suppliers
- Near-term spending needs fall → more available for investment
- Monetary expansion by the central bank → more funds available
- Economic conditions improve (inflation, unemployment, growth) → the flow of funds to the country increases
3 · What shifts the demand for funds
- Utility from assets bought with borrowed funds rises → market participants borrow more
- Non-price conditions on borrowing become less restrictive → borrowing increases
- Economic conditions improve — a period of growth → borrowing increases
The ECB’s 2022–2023 hiking cycle: which curve moved, which way, and did the quantity of loanable funds rise or fall? (The rate going up does not settle it.)
3 · The interest rate over the business cycle
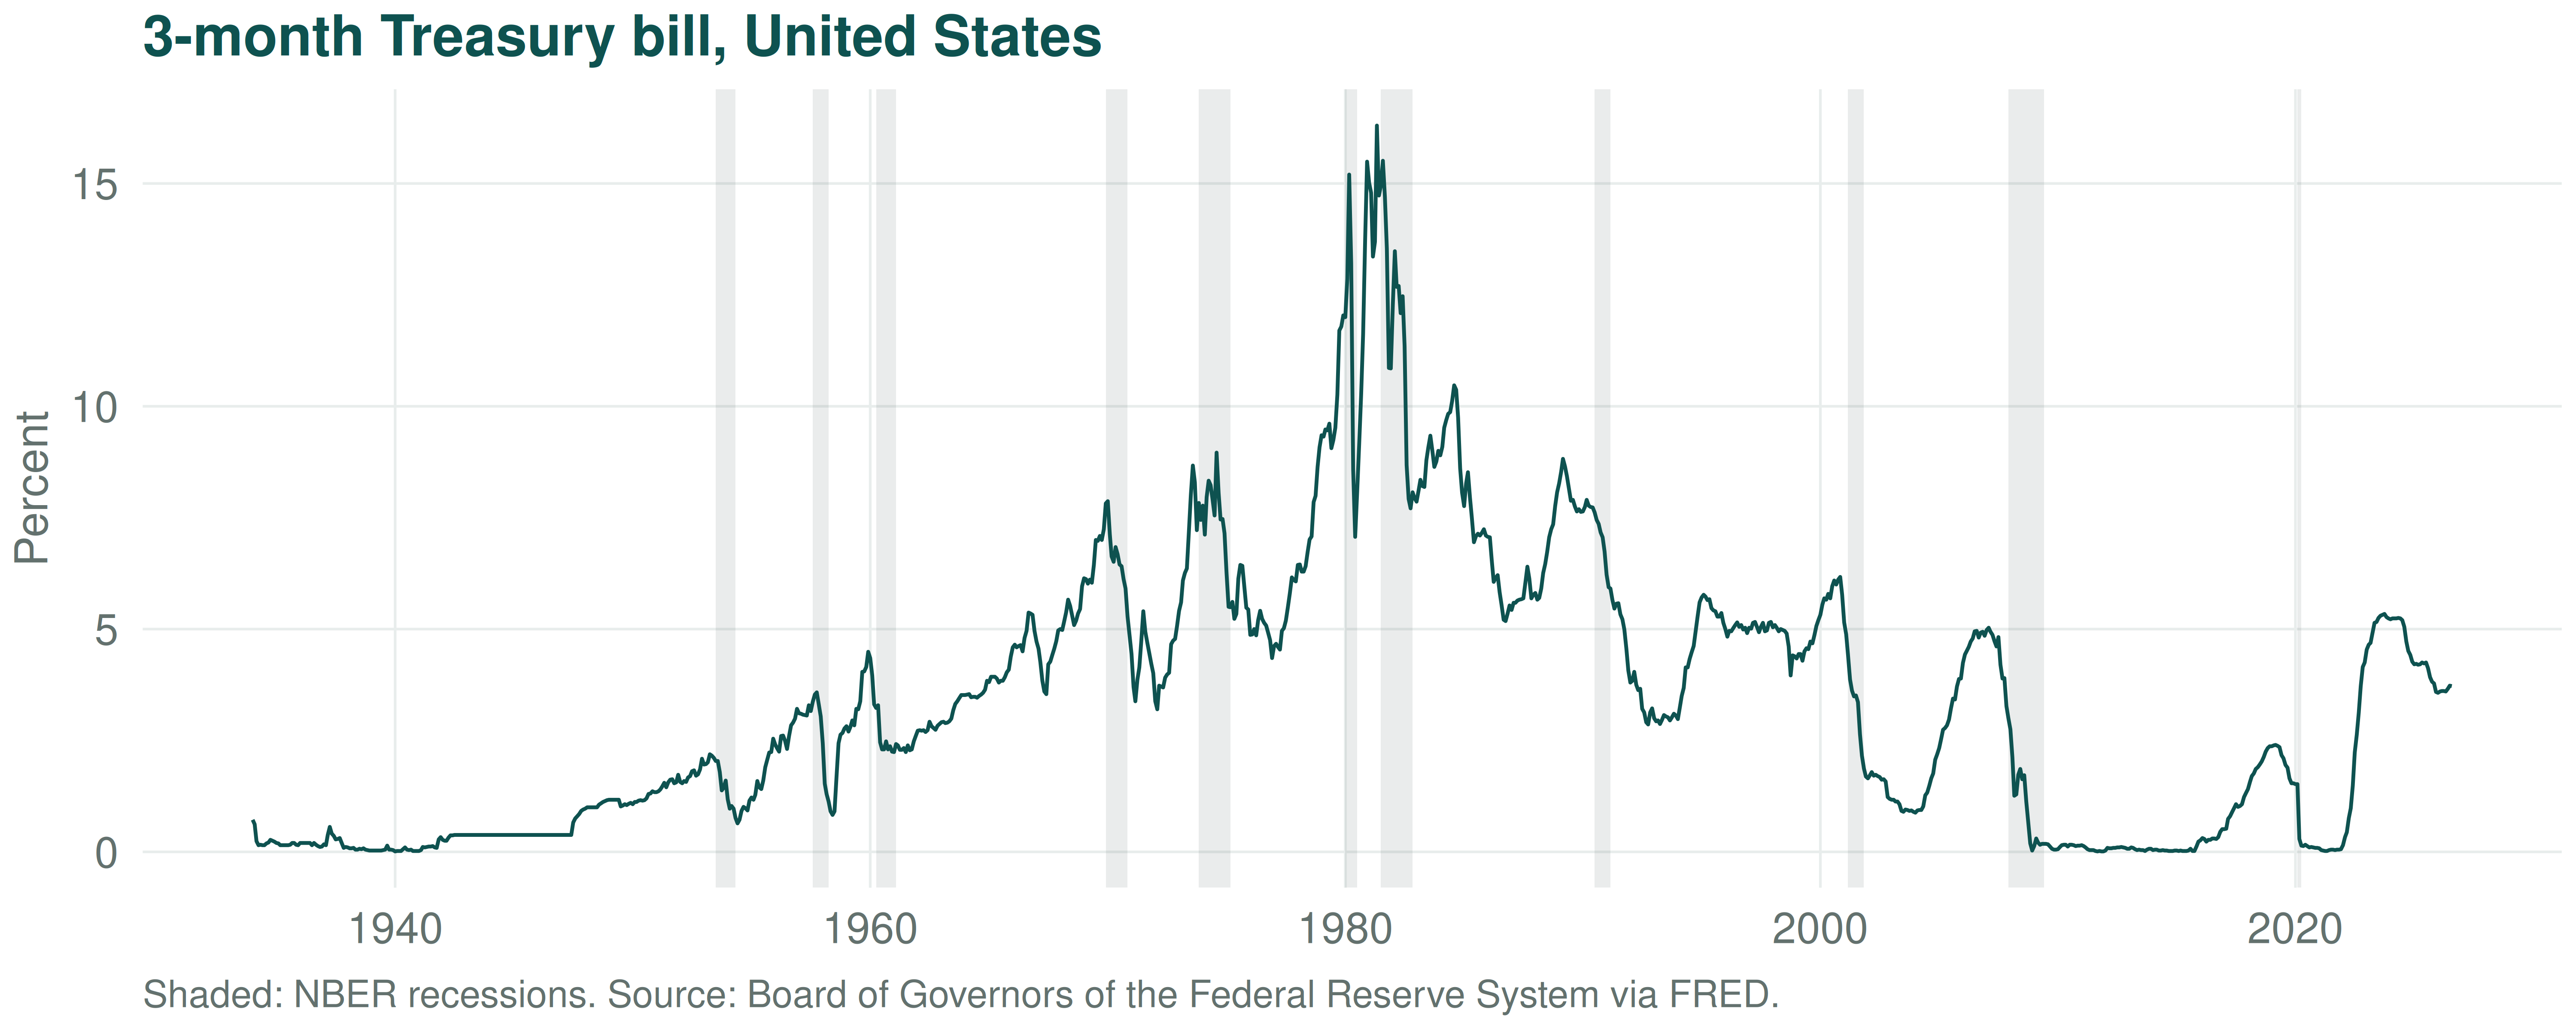
What is the relationship between the business cycle and interest rates — and which way does the causality run?
3 · The interest rate and the CPI
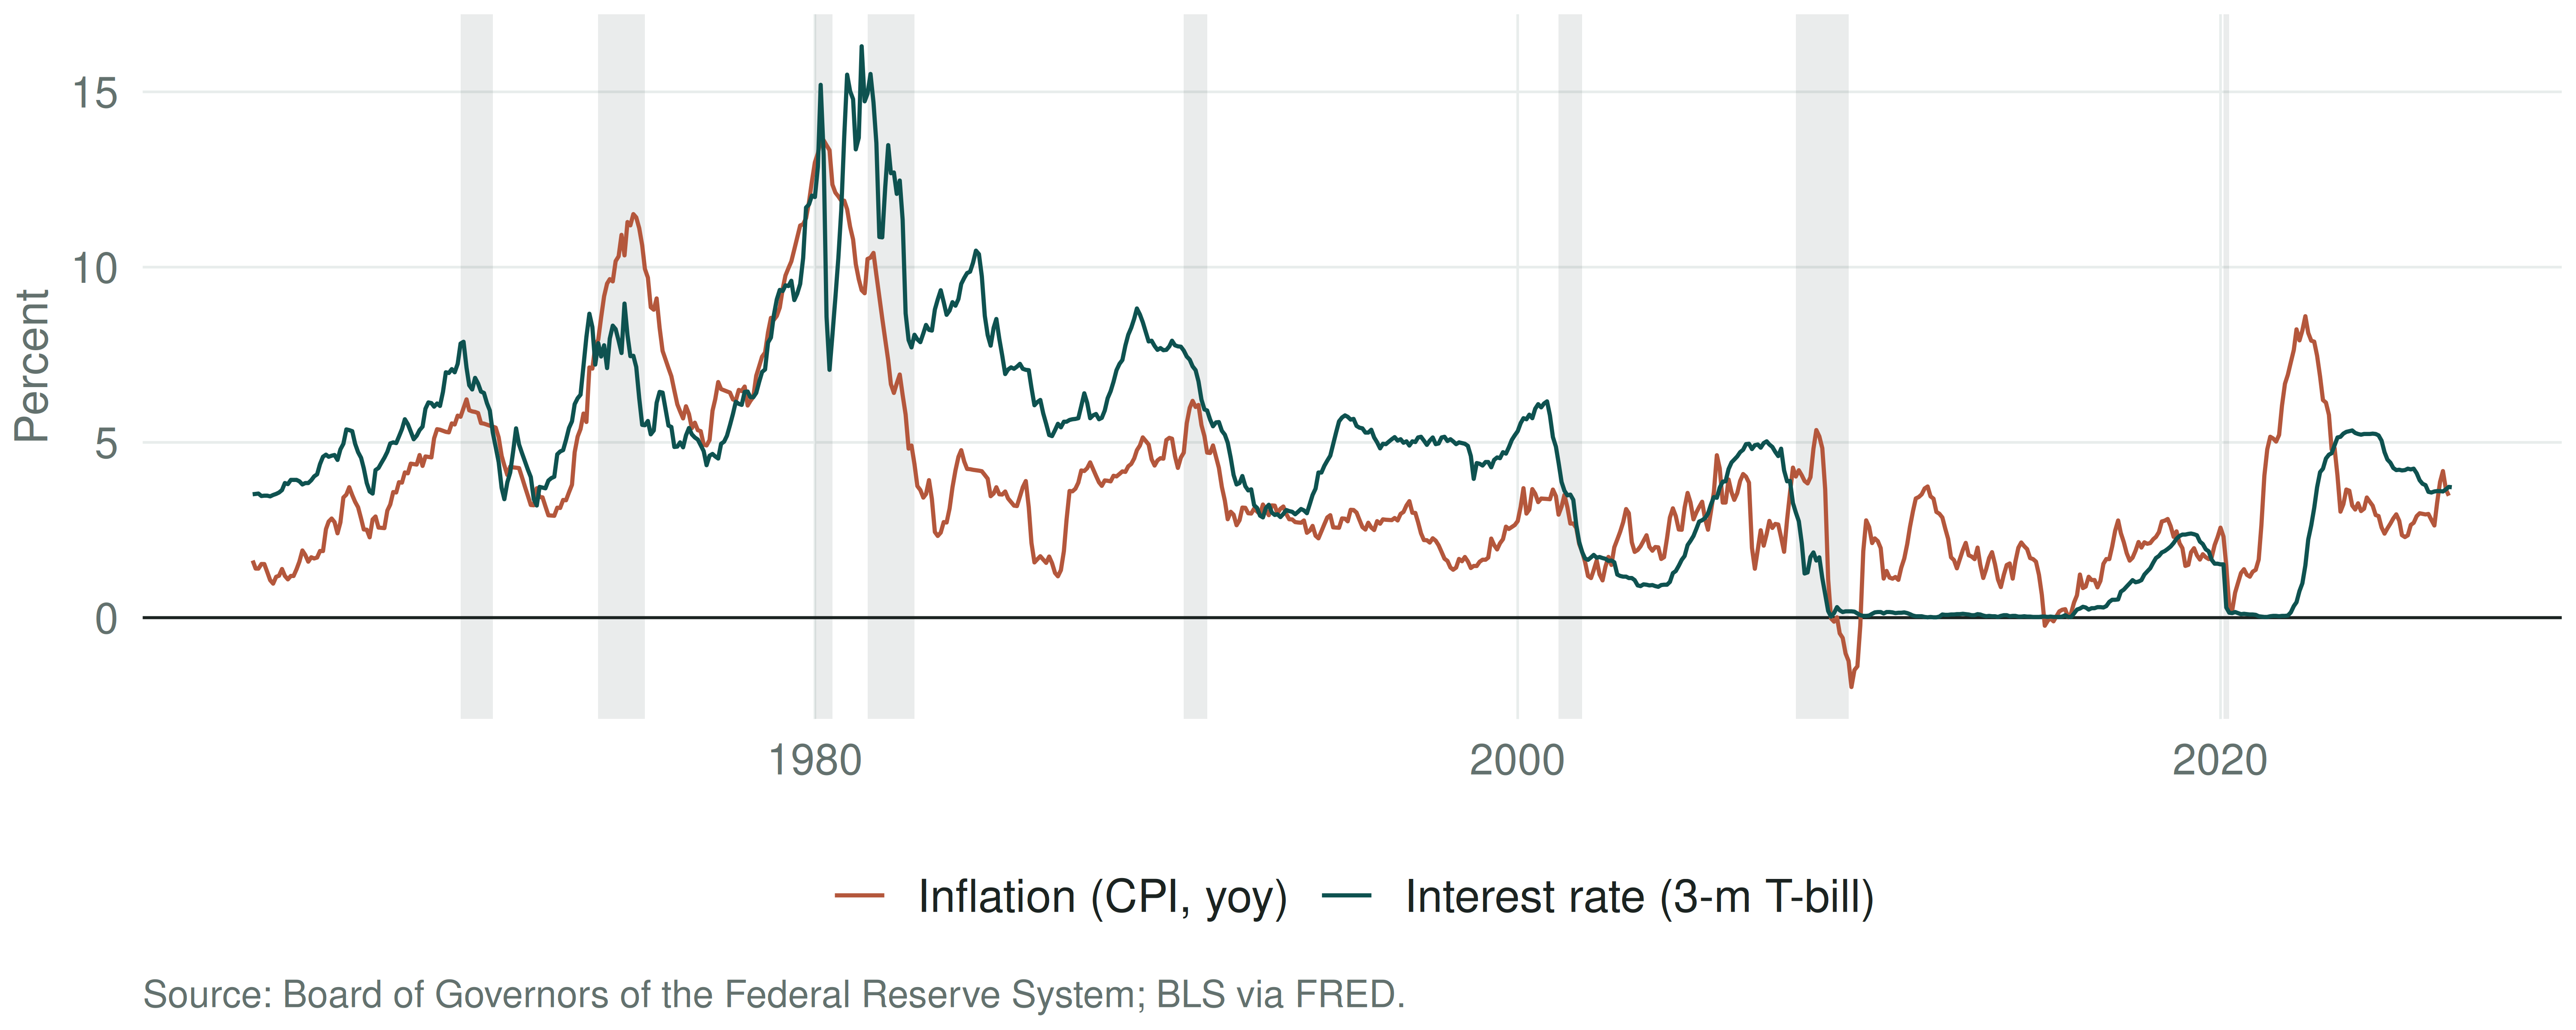
What is the relationship between the interest rate and the CPI?
3 · Real and nominal
i_r = i - \pi^e The real rate is the nominal rate adjusted for expected changes in the price level. It reflects the true cost of borrowing.
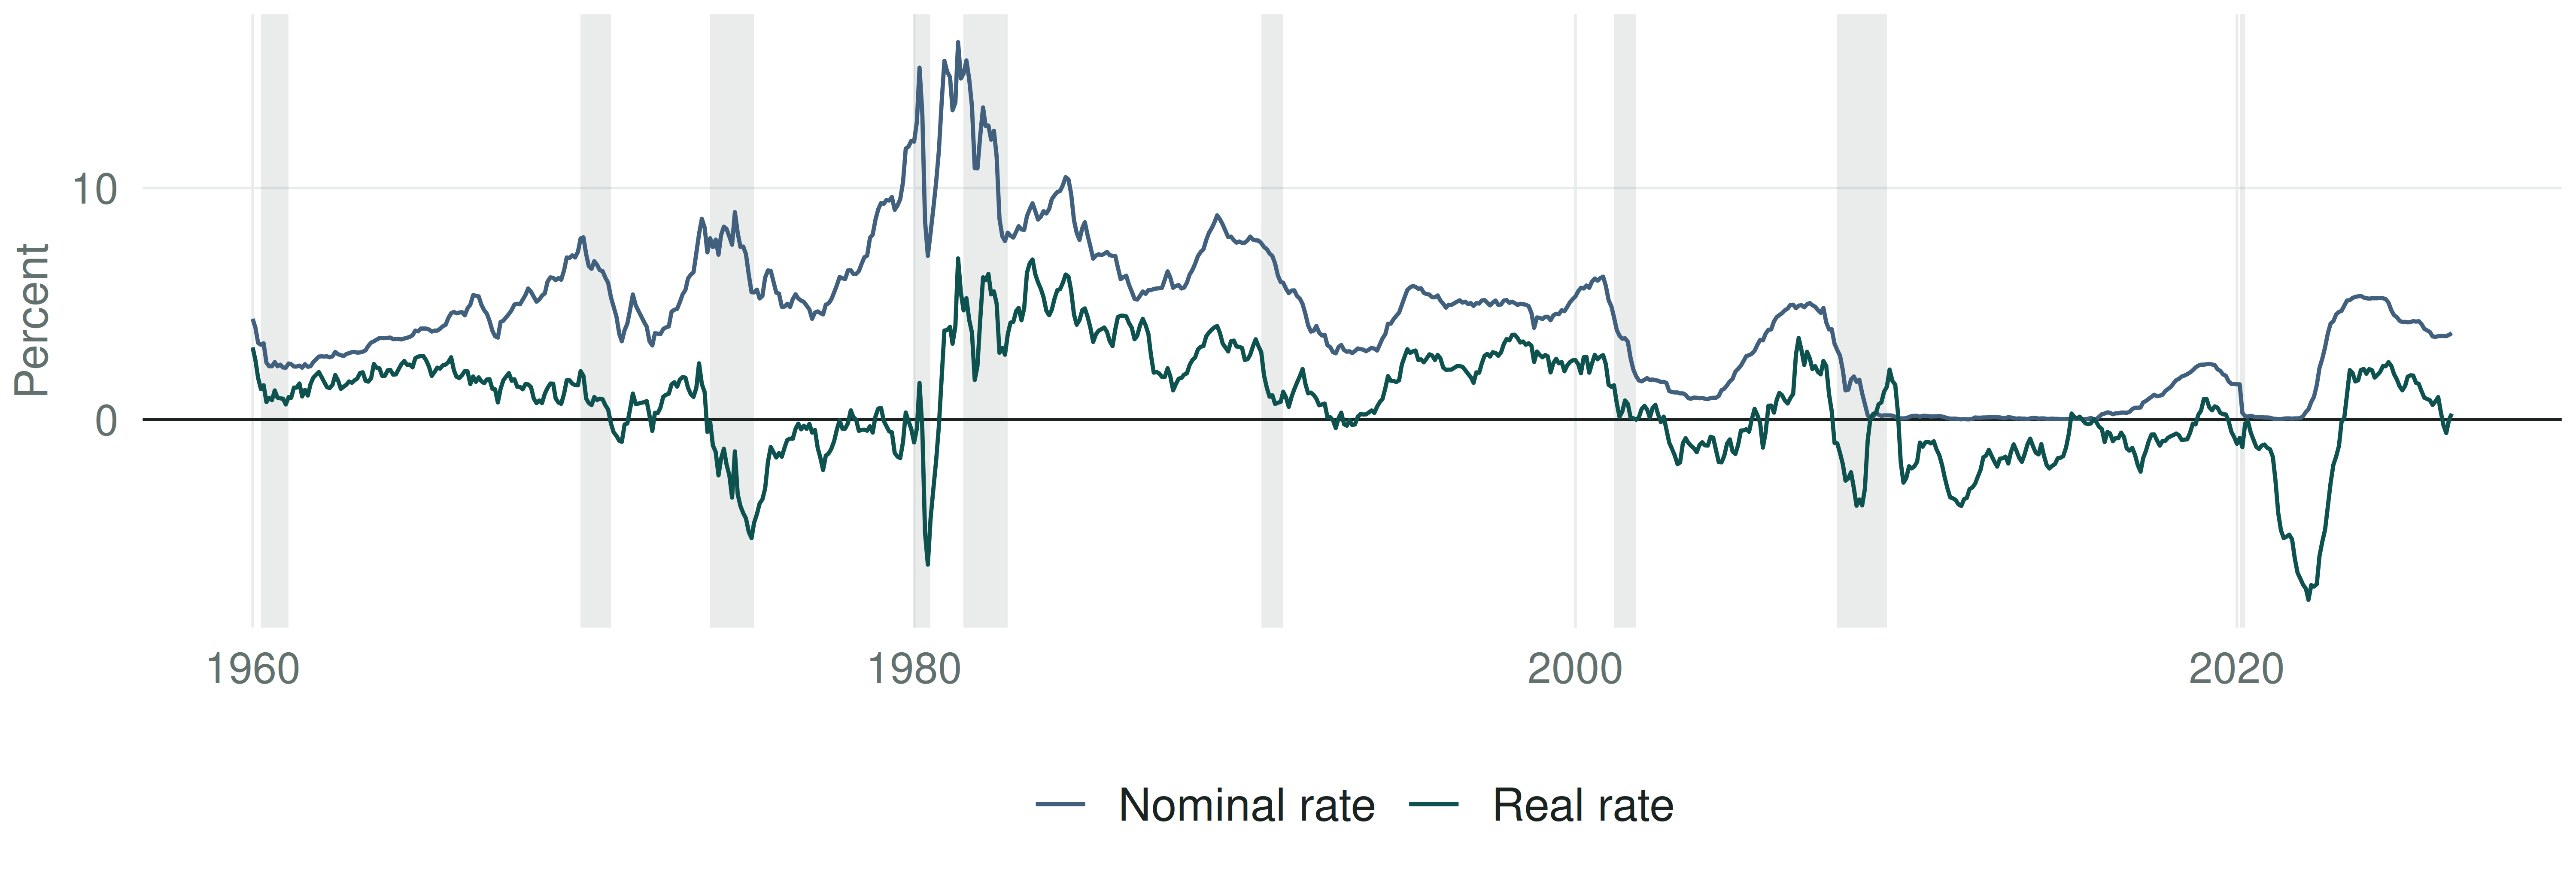
When the real rate is low, borrowing looks clever and lending looks foolish. Find the stretches where it was negative — someone was quietly transferring wealth to someone else. Who, and to whom?
3 · Risk and term structure
The risk that the issuer is unable or unwilling to make interest payments as promised. Bonds with no default risk — U.S. Treasuries, which can raise taxes or print money — are the benchmark. The risk premium is the spread between a bond with default risk and a default-free bond.
A liquid asset is quickly and cheaply converted into cash. Demand is higher for more liquid assets, so the premium reflects both default risk and liquidity.
Tax exemption acts like an increase in expected return. U.S. municipal bonds are exempt from federal income tax; Treasuries are exempt from state and local income tax.
Rates at different maturities move together. When short rates are low, yield curves tend to slope steeply upward; when short rates are high, the curve tends to slope gently downward. Most of the time it slopes upward.
3 · Yield curves
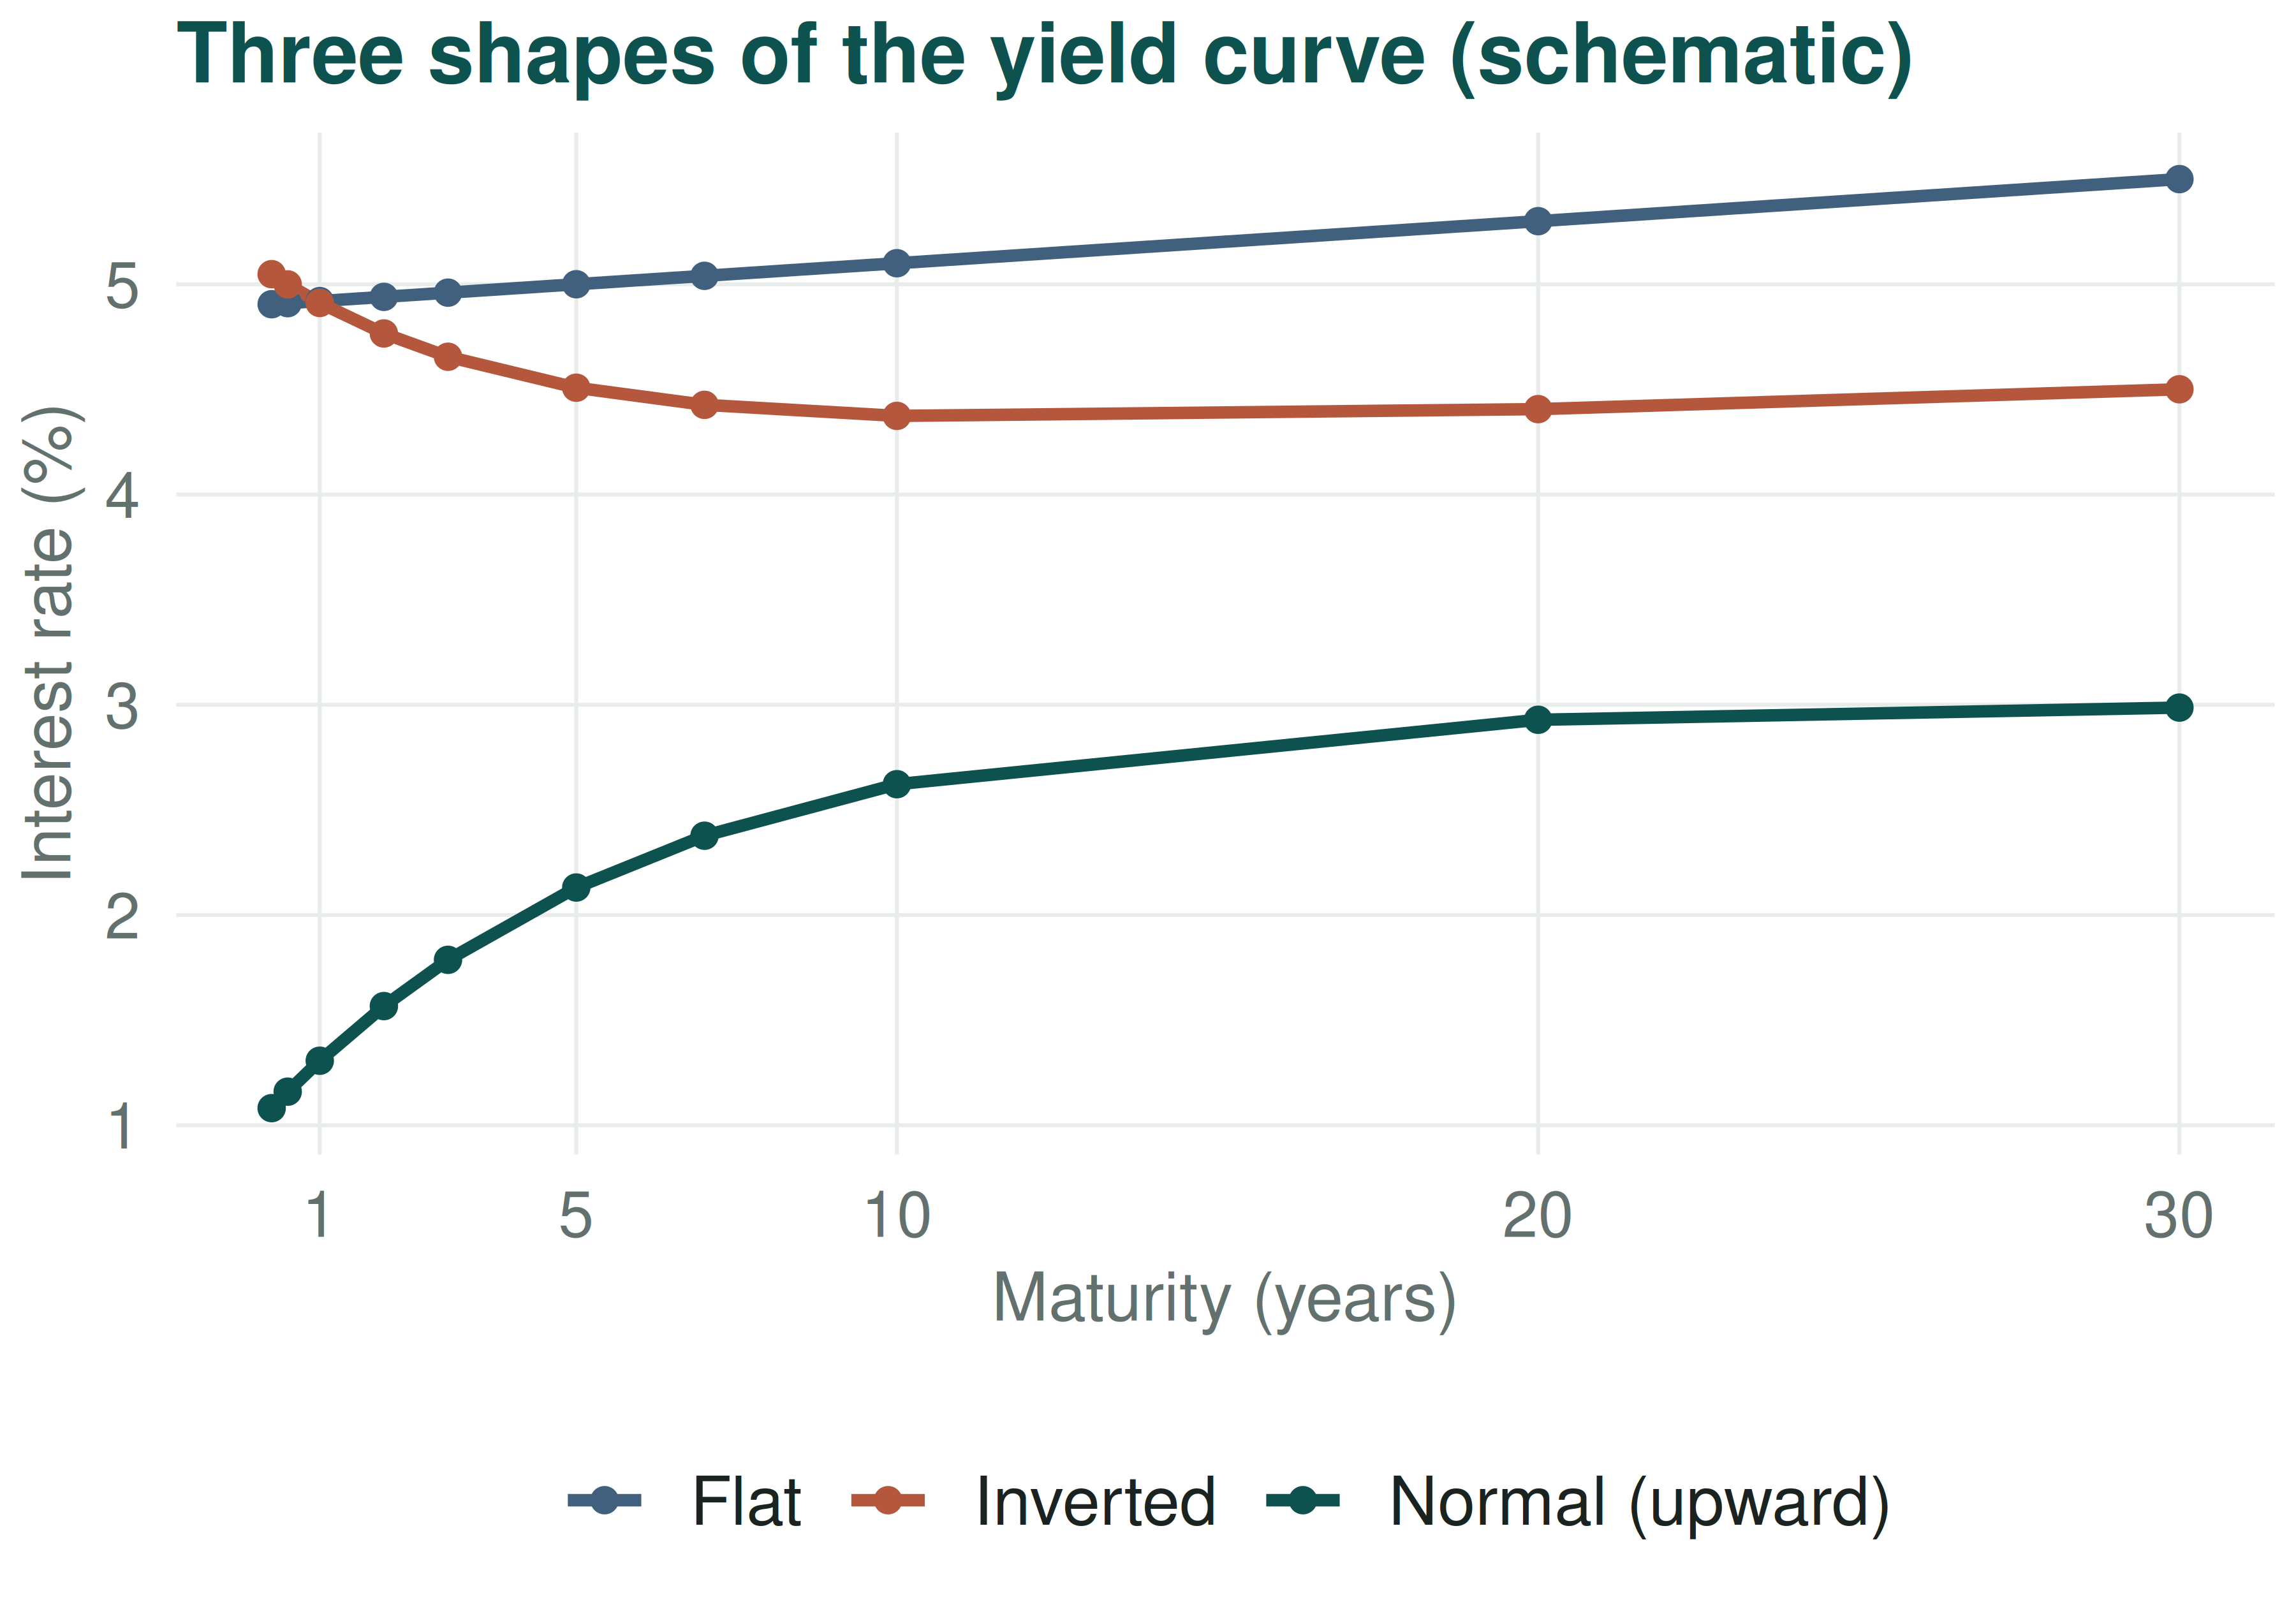
Most of the time the curve slopes upward. The two other shapes are the interesting ones.
An inverted curve has preceded most U.S. recessions. Does that make it a forecast, or a symptom?
Live curve: U.S. Treasury daily yield curve rates. Pull the current one before class — the shape today is the best slide you have.
4 · The exchange rate
15 January 2015
For three years the Swiss National Bank had promised it would not let the franc strengthen past 1.20 per euro. That morning, it stopped. The franc jumped by roughly a fifth against the euro within the day, and several retail FX brokers did not survive the week.
- A fixed exchange rate is a promise, and a promise is worth exactly the reserves standing behind it.
- Section 4: who makes the promise, what it costs to keep, and what happens on the day it breaks.
photo idea: the EUR/CHF chart of 15 Jan 2015, or a Swiss franc note — search “EURCHF january 2015 chart”
4 · Exchange rate regimes
| Regime | Definition | In favour | Against |
|---|---|---|---|
| Fixed | Rates held constant or fluctuating within very narrow boundaries | MNCs operate more easily | Government may alter the value of a currency |
| Free float | Rates determined by market forces, no intervention | Problems in one country spread less easily; no intervention policy needed; market efficiency enhanced | MNCs must manage the exposure; countries with severe problems may struggle |
| Managed float | Market forces with government intervention | Governments manipulate the rate for their own benefit | |
| Pegged | Home currency pegged to a foreign currency or unit of account | Hard to defend against speculators in a crisis | |
| No national currency | The country uses another currency, e.g. the U.S. dollar |
4 · Exchange rate policy
- The spot market is the immediate purchase or sale of foreign exchange. S(j/k) is the price of one unit of currency k in terms of currency j.
- The exchange rate is the result of national currency supply and demand: the price of a currency in terms of another.
- Exchange rate policy is a component of economic policy. Authorities can defend the rate by
- fixing short-term interest rates to prevent capital flight,
- buying and selling on the foreign exchange market,
- controlling exchanges through quantitative restrictions on capital movements.
4 · Fixed versus flexible: the pound market
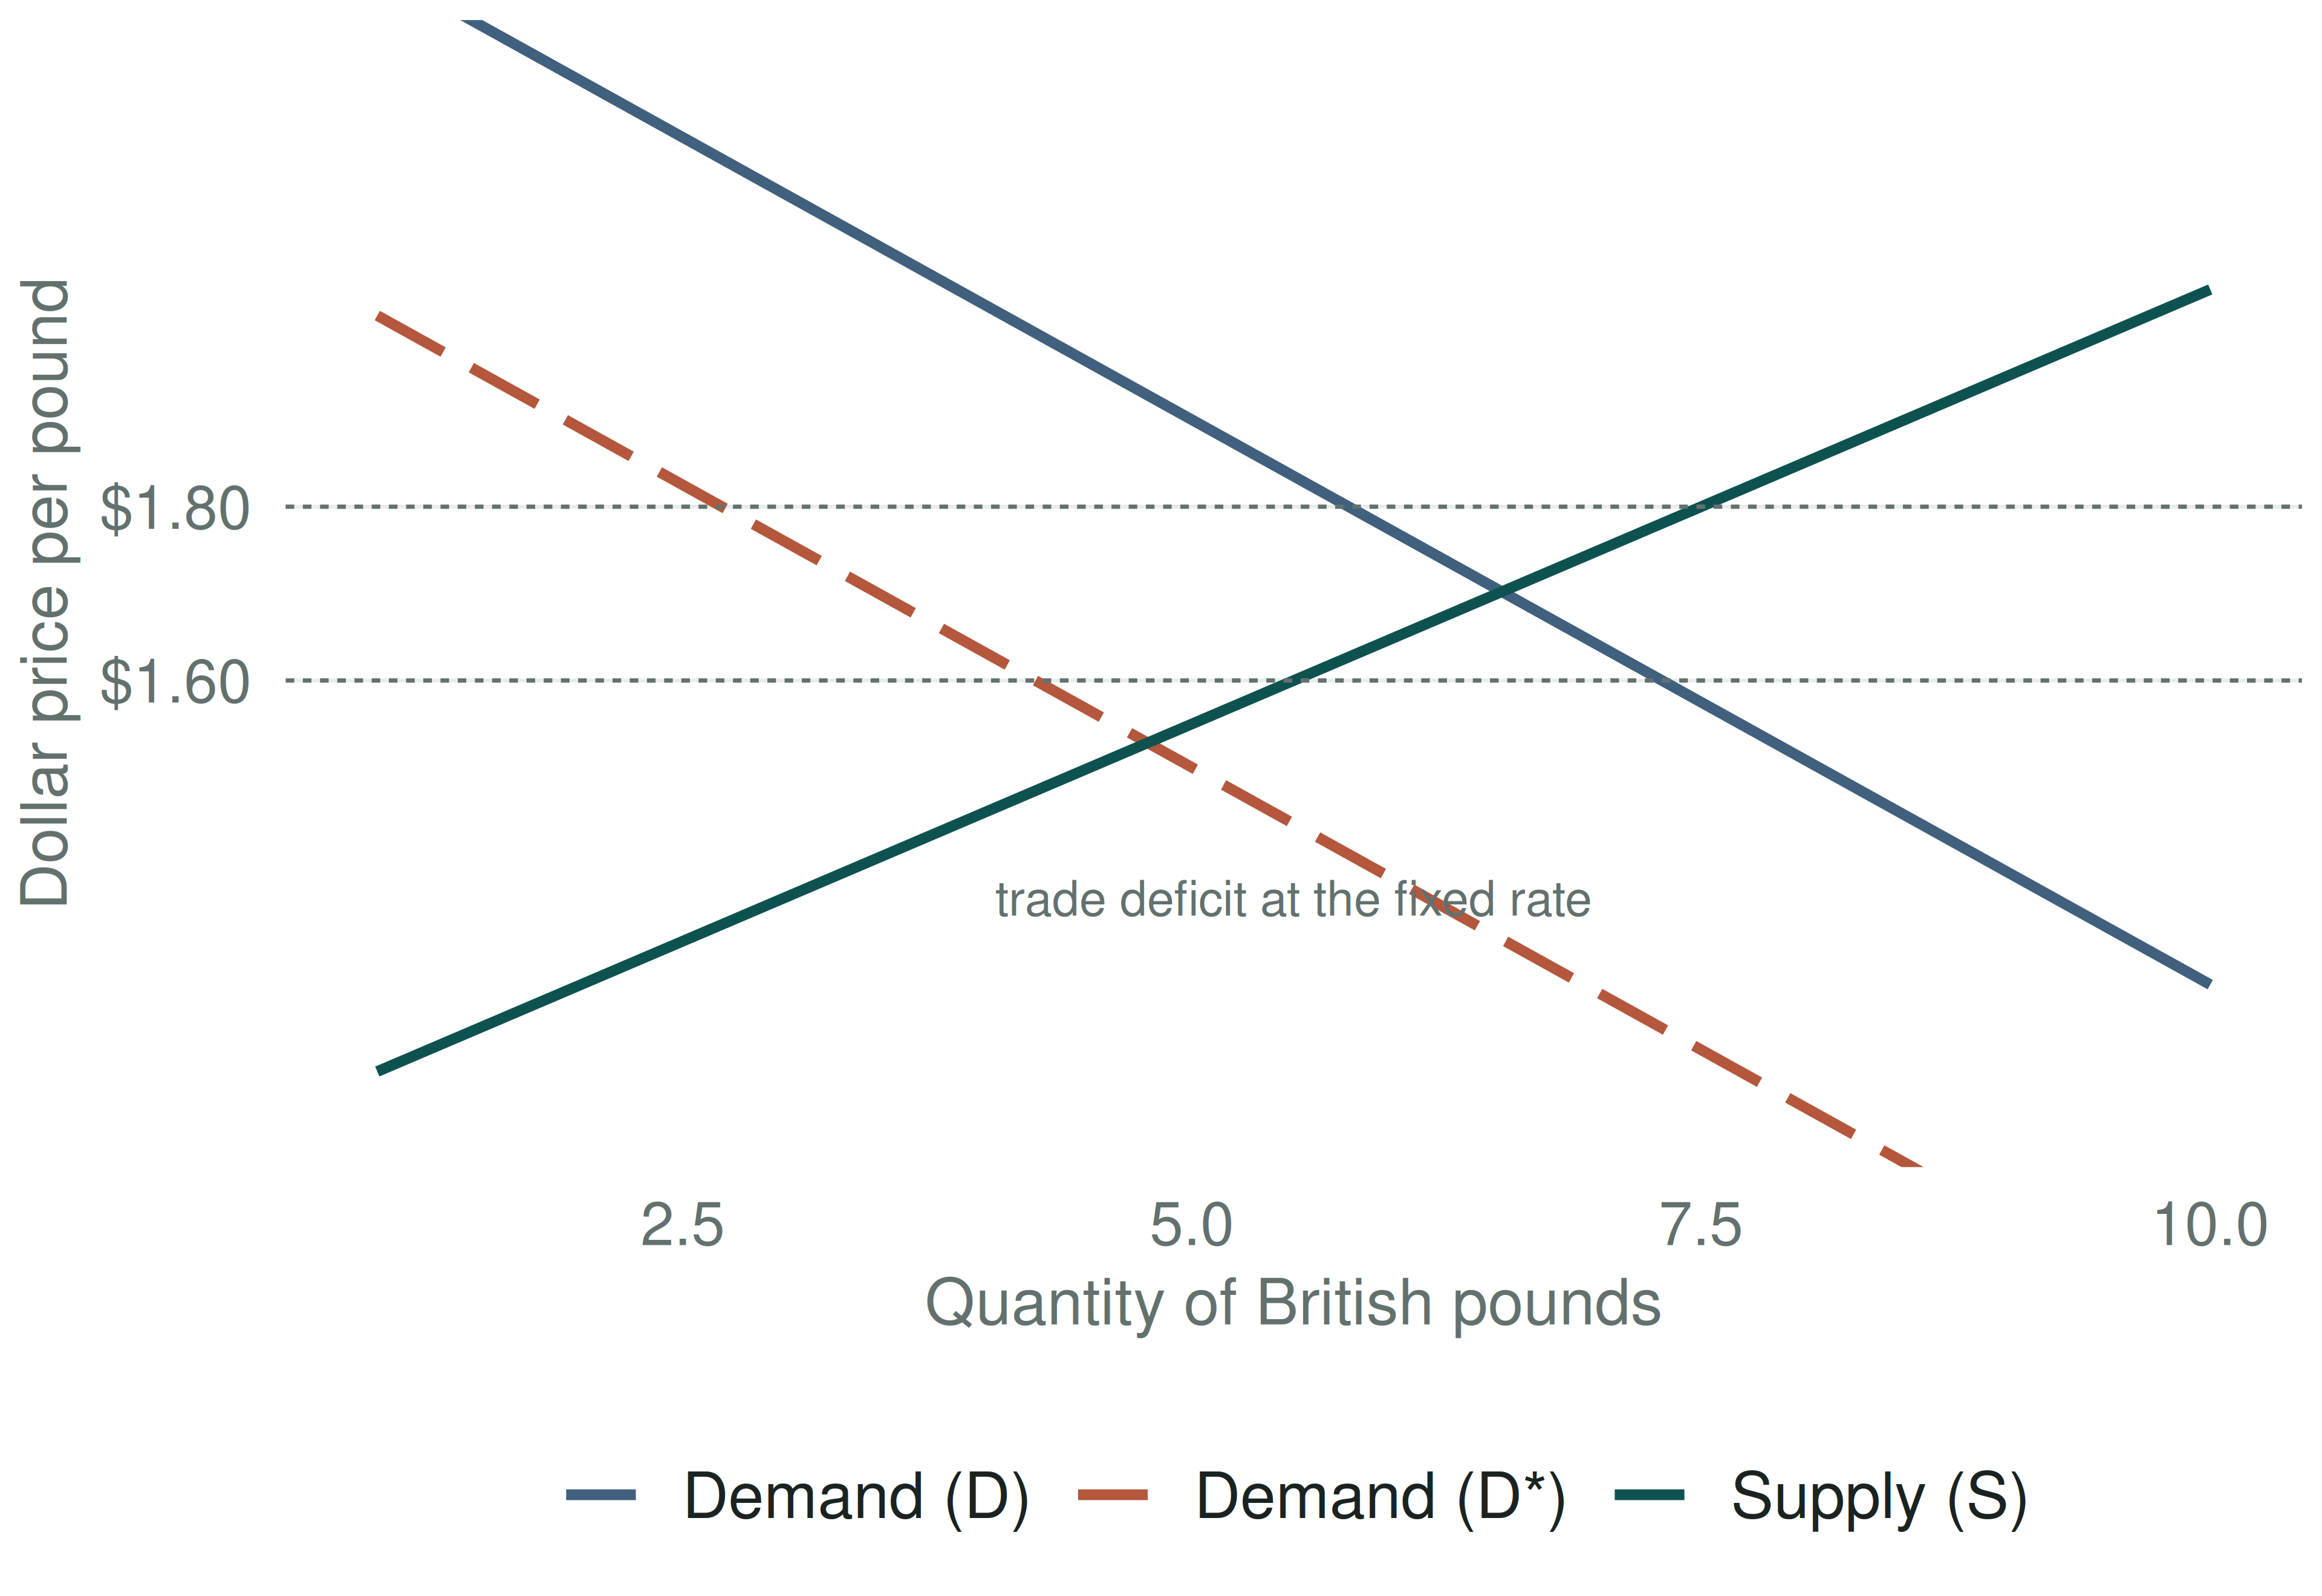
The rate starts at 1.60 $/£ and the U.S. runs a trade deficit.
- Flexible: the dollar depreciates to 1.80 $/£ and the deficit disappears.
- Fixed: the rate stays at 1.60 and the Fed supplies pounds out of reserves — or runs contractionary policies to shift demand back.
4 · The Mundell–Fleming model
A small open economy with perfect capital mobility, so i = i^{*}.
IS — goods market, for a given i^{*}:
Y = C(Y-T) + I(i^{*}) + G + NX(e)
LM — money market, for a given i^{*}:
M/P = L(i^{*}, Y)
LM is vertical: given i^{*} only one Y clears the money market, whatever e. That single fact drives every result on the next slide.
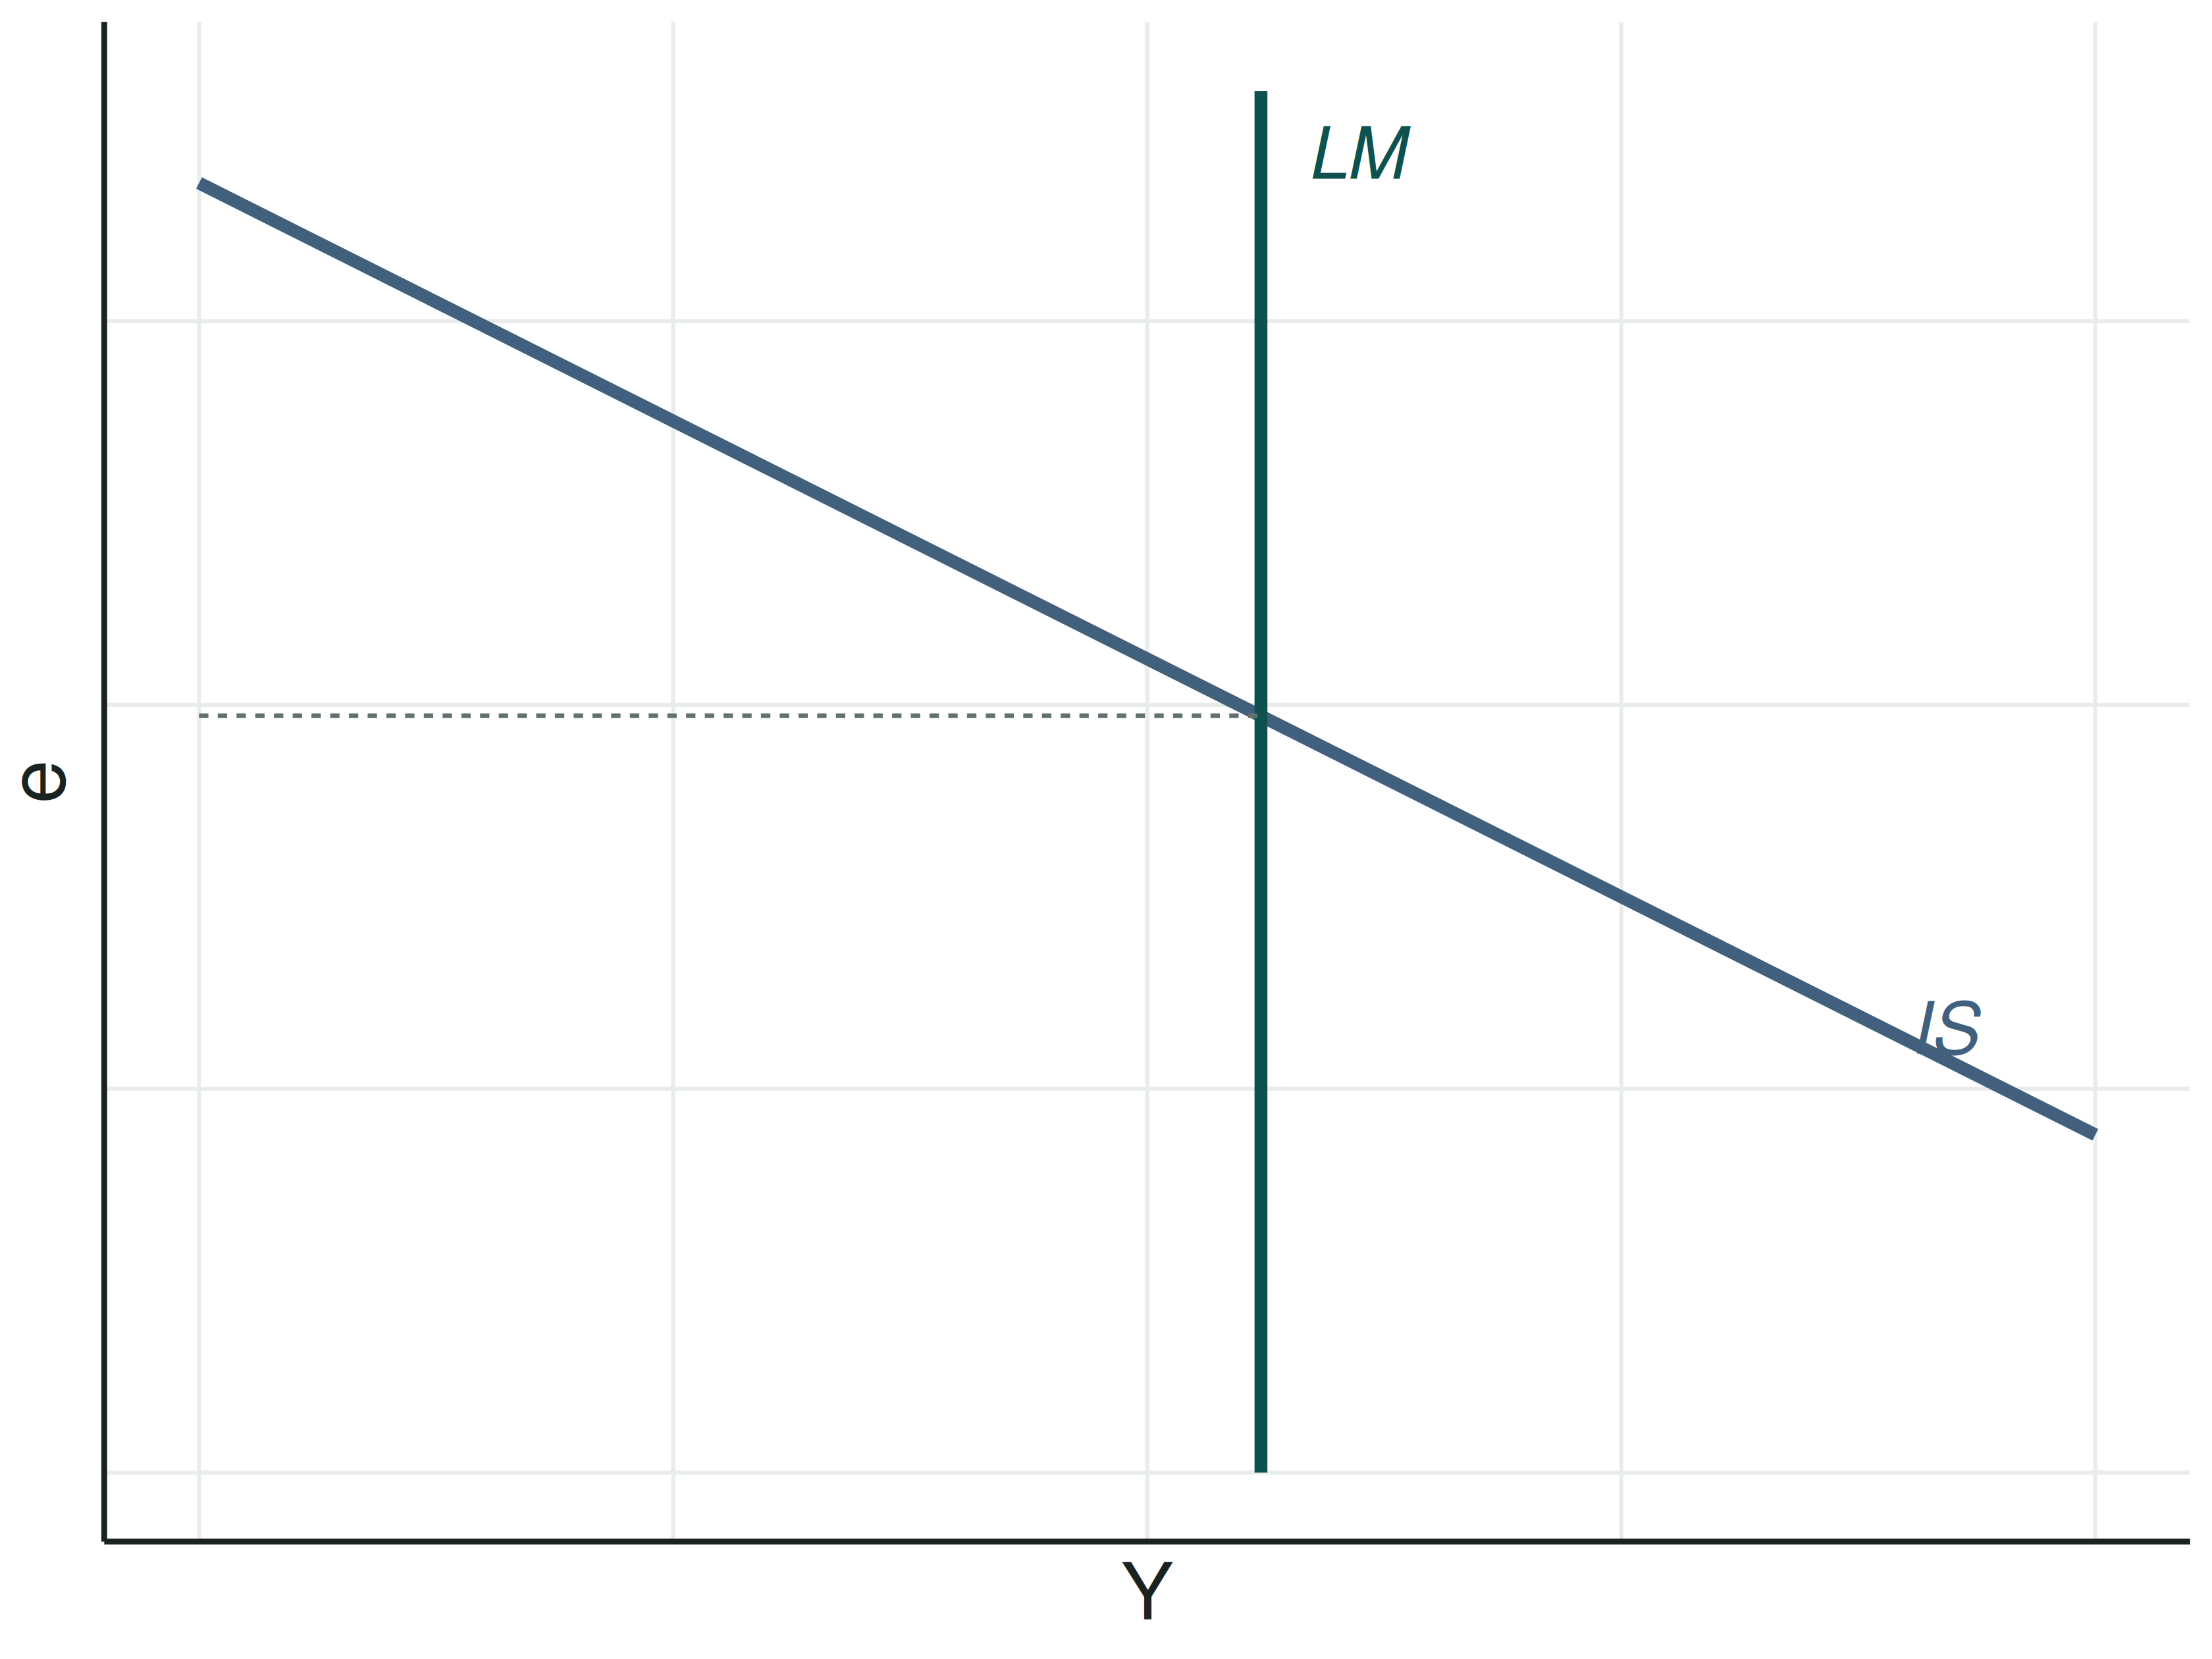
e = nominal exchange rate, foreign currency per unit of domestic currency.
4 · Problem 1.3 — policies in the Mundell–Fleming model
What is the consequence of a fiscal expansion, a monetary expansion and a trade restriction on the exchange rate and on output — under floating and under fixed rates?
| Policy | Floating: e | Floating: Y | Fixed: e | Fixed: Y |
|---|---|---|---|---|
| Fiscal expansion | ||||
| Monetary expansion | ||||
| Import restriction |
Fill the table with them — press C and draw the IS and LM shifts for each row before writing the sign.
4 · Currency supply and demand
| Domestic currency supply | Domestic currency demand | |
|---|---|---|
| Private sector | Purchase of foreign goods and services (imports) | Purchase of domestic goods and services (exports) |
| Income paid on non-residents’ investments here | Income received on residents’ investments abroad | |
| Unilateral transfers out | Unilateral transfers in | |
| Net purchase of foreign assets by residents (capital outflow) | Net purchase of domestic assets by non-residents (capital inflow) | |
| Foreign debt repayment (cash outflow) | Settlement of foreign credit (cash inflow) | |
| Central bank | Foreign currency purchased (reserves increase) | Foreign currency sold (reserves decrease) |
4 · Central bank intervention
What is the ECB’s intervention in the foreign exchange market in each of these two situations?
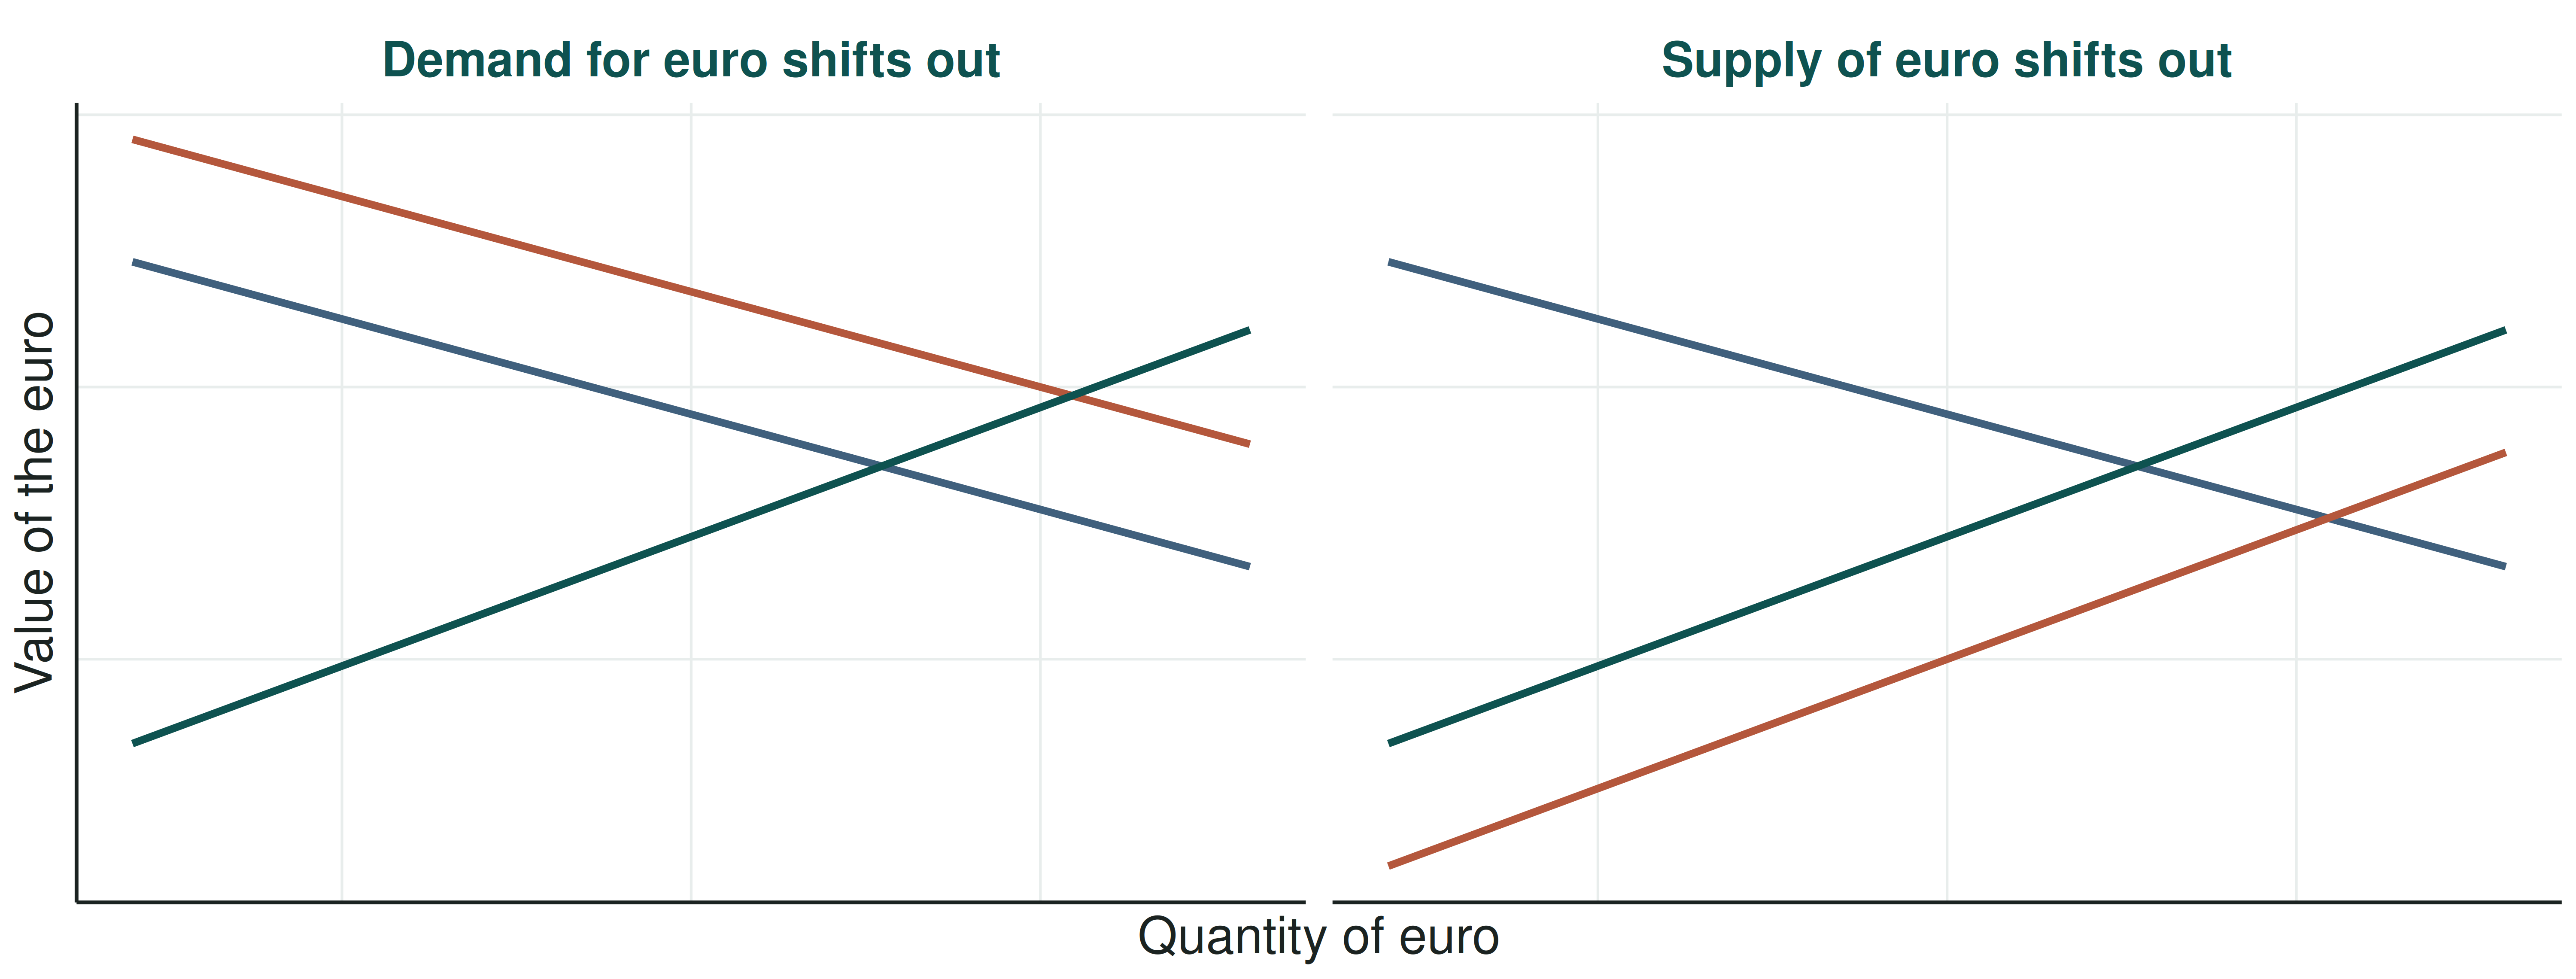
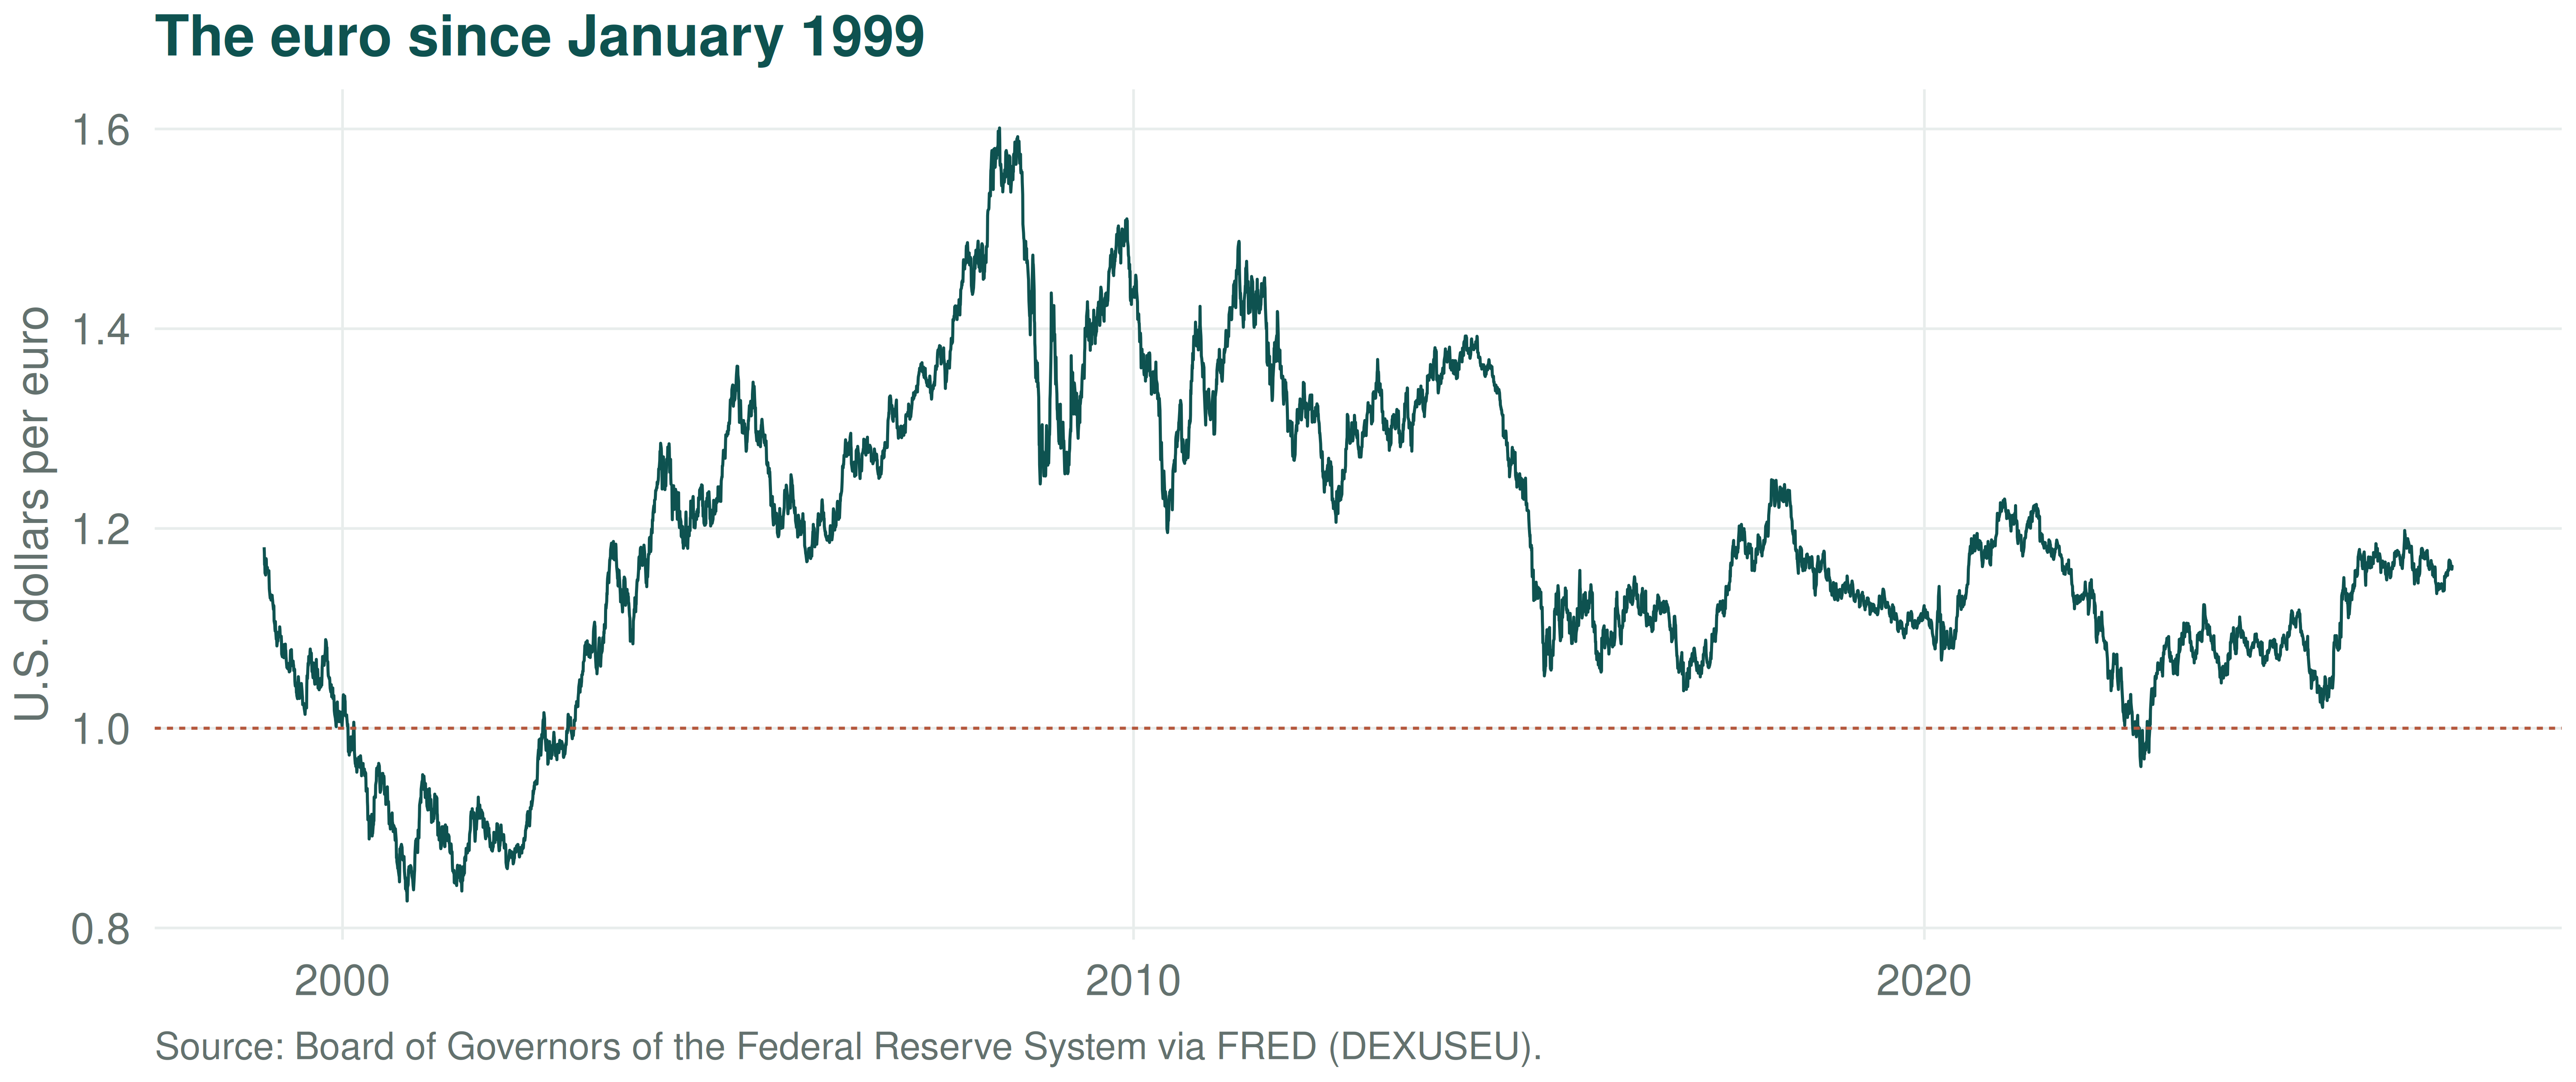
4 · The euro against the dollar
4 · The Asian crisis (1)
- In 1997–98 Thailand was at the centre of a financial crisis.
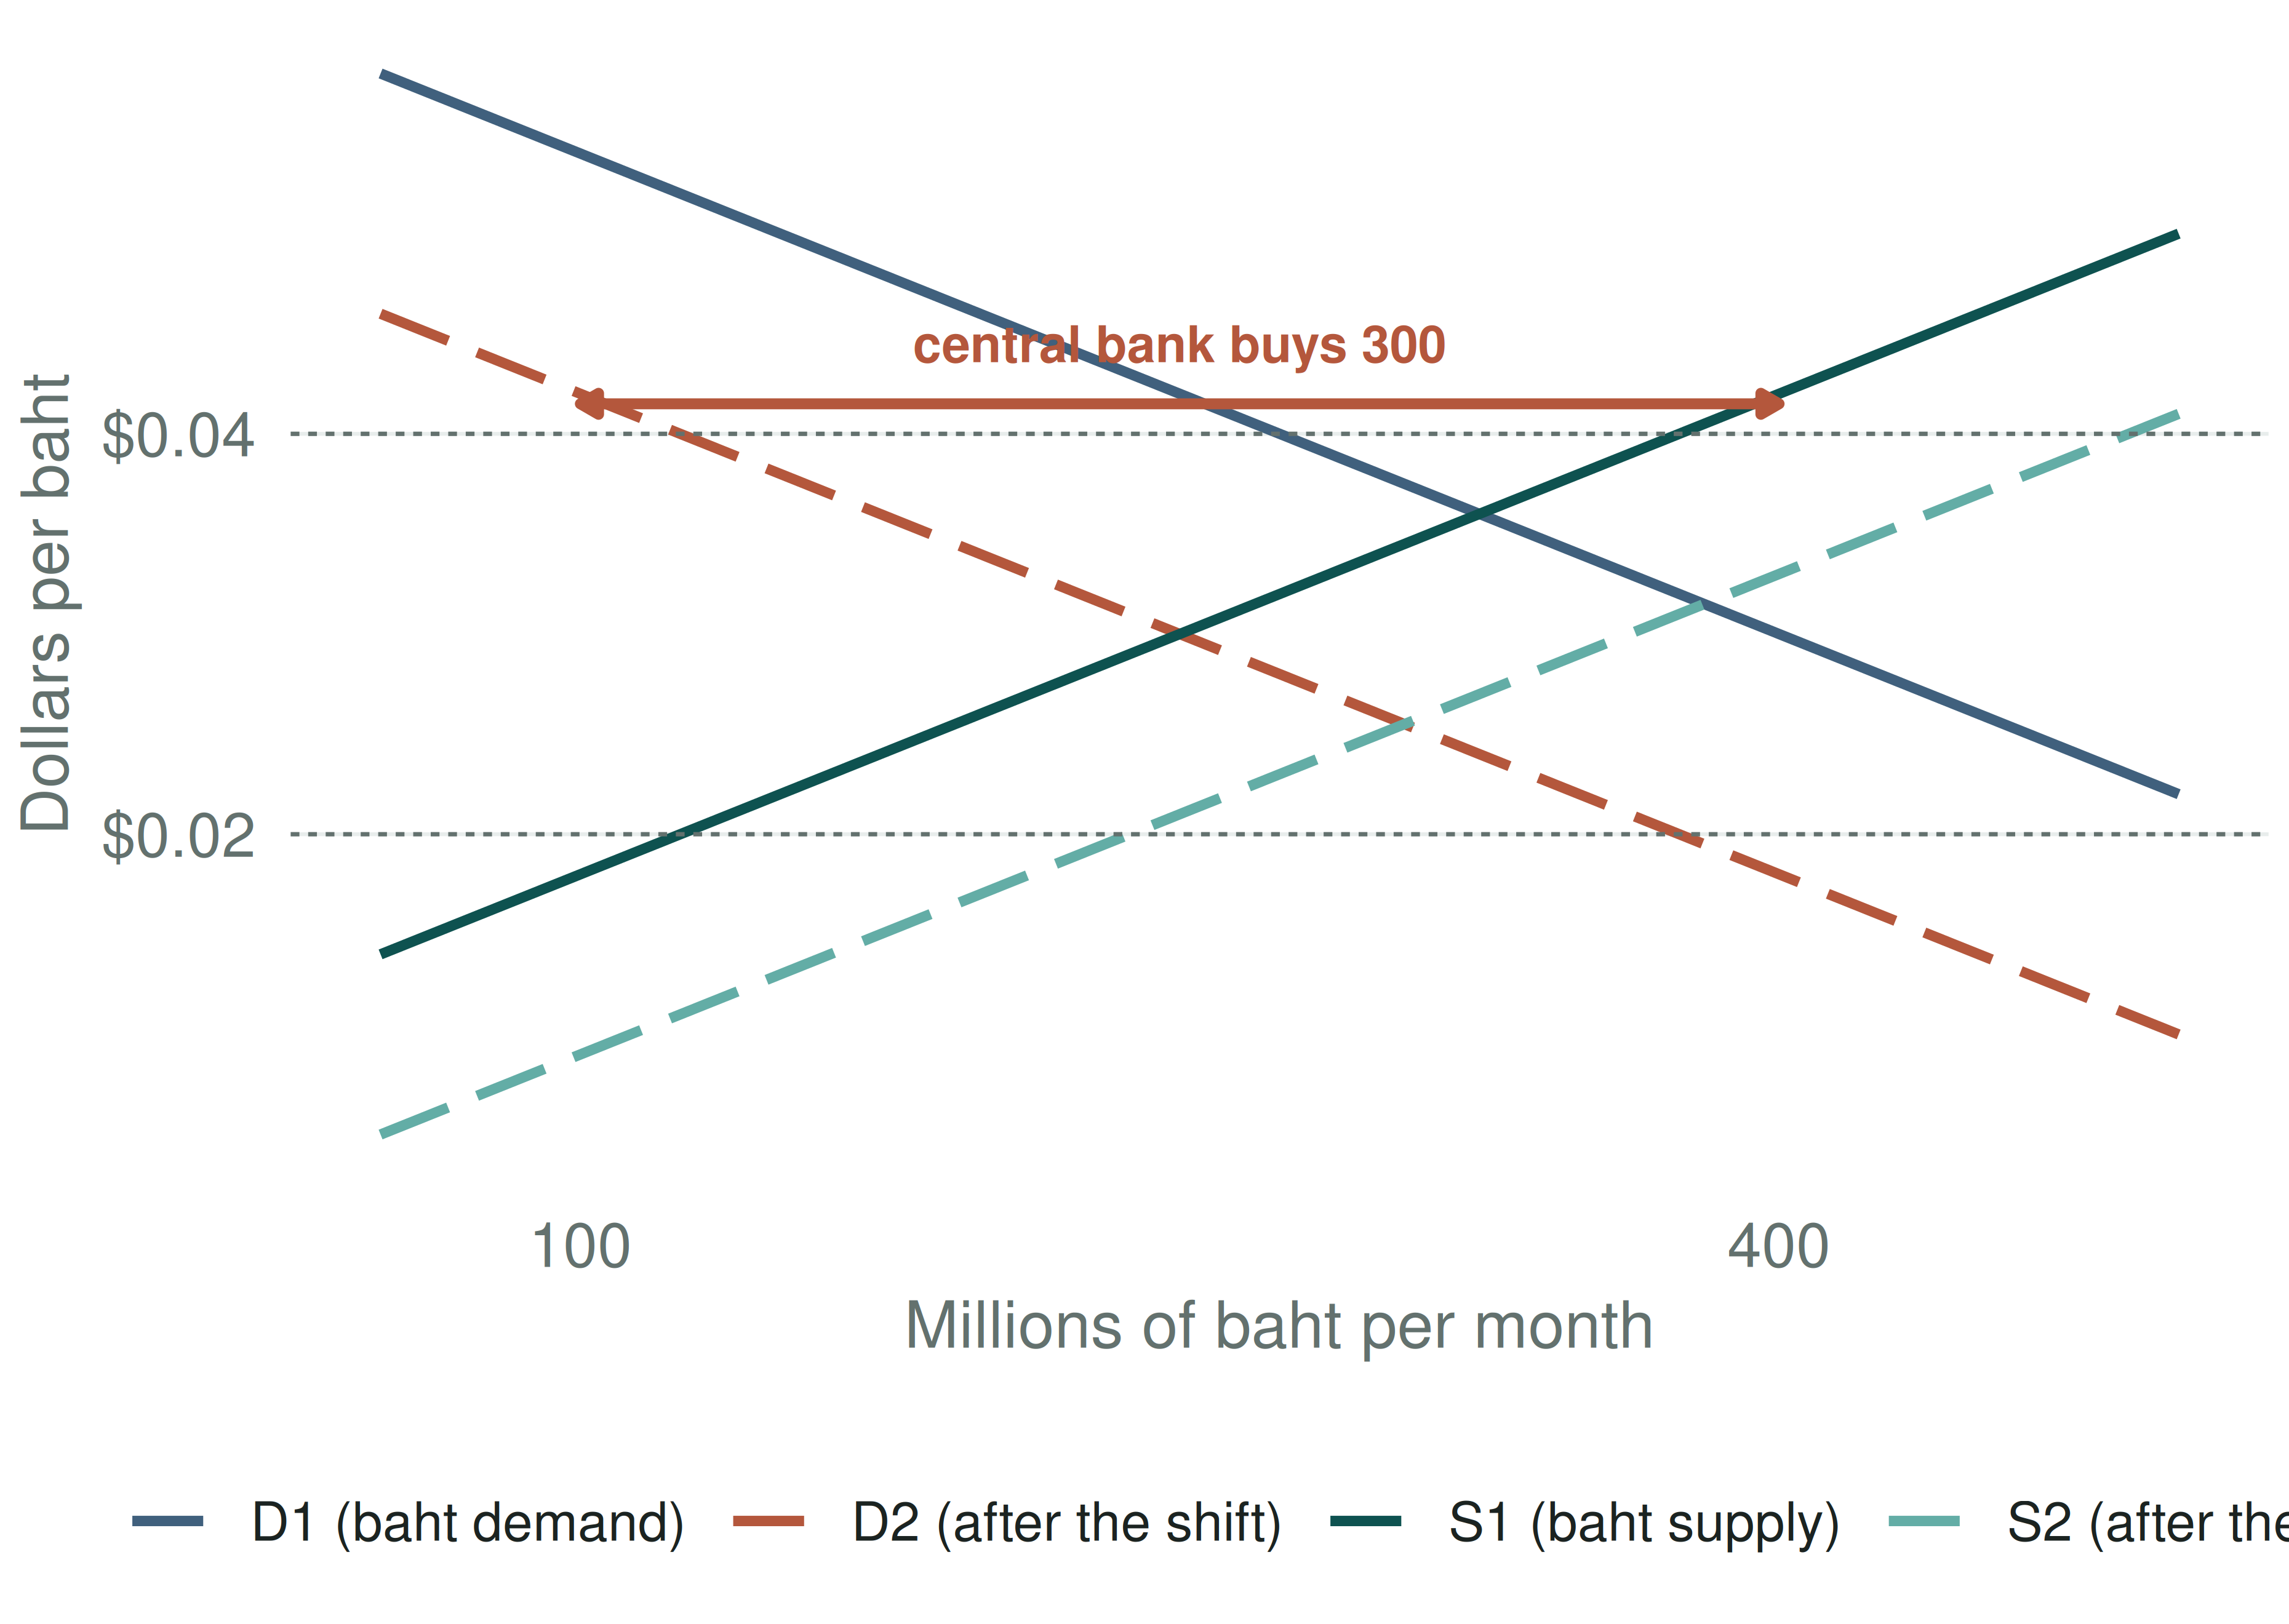
- It began with a loss of confidence in the Thai financial system: the supply and demand curves for baht shifted, the equilibrium rate fell, but Thailand kept the actual rate fixed at $0.04 — above equilibrium.
- The central bank depleted its dollar reserves defending it, which led traders to anticipate a devaluation and shift the curves further.
- In July 1997 it ran out of reserves and let the baht float. It fell immediately from $0.04 to $0.02.
- Thai banks, counting on the fixed rate, had borrowed heavily in dollars and yen and lent in baht. That currency mismatch is the crisis.
How did the Thai central bank maintain the fixed rate — and why did it try?
4 · The Asian crisis (2)
At the fixed rate of $0.04, once the equilibrium has fallen to $0.02, the central bank must buy 300 million baht a month with dollars.
- Once reserves are gone there are two choices: float (immediate depreciation) or declare a new, lower fixed rate — a devaluation.
- Speculators anticipate the drop, which lowers the equilibrium value further and increases the excess supply of baht.
- Defending the rate gets harder the longer you defend it.
5 · Reading discussion
The tragedy of the horizon
Mark Carney, at Lloyd’s of London in 2015: the costs of climate change fall beyond the horizon of the business cycle, the political cycle and the investment cycle.
By the time it is unambiguously a financial risk, it is too late to treat it as one.
photo idea: flooded street, or a stranded coal plant — search “flooded street climate” or “abandoned coal power plant”
5 · Monasterolo (2020), Climate Change and the Financial System
(a) Why is there a misalignment between climate impacts and investors’ decisions?
(b) What are the various climate physical risks?
(c) What are the potential risks arising from policy and regulatory shocks?
(d) Why is assessing climate risks challenging?
- Answer (a) with the horizons: the tragedy of the horizon — climate damages fall outside the investment and electoral cycle, so they are not priced.
- For (c), separate an orderly transition from a disorderly one. The risk to a portfolio is the disorderly path, not the transition itself.
- For (d), the honest answer is that the historical distribution does not contain the events we are pricing. That is a problem for every risk model in this course.
If climate risk is not priced because horizons are misaligned, which of the four sections of today’s session does the correction have to come through — markets, the balance of payments, the interest rate, or the exchange rate?
Next session
Session 2 finishes the international financial system.
Two things to bring: Monasterolo (2020), read — and one security you might actually want to analyse for the group work. Not “a stock”. A specific one, with a ticker.
Press O for the slide overview · C to draw · S for speaker notes · F for fullscreen · E then print for a PDF of the slides.
International Finance · Session 1 · KEDGE