International Finance

Session 2 — Interest Rates, Exchange Rates and the Climate Reading

Laura Contreras-Portela

KEDGE Business School

October 2026

3 · The Interest Rate

The week a number moved a pension fund

September 2022, the UK. Gilt yields jumped after the mini-budget. Pension funds running leveraged liability-driven strategies got collateral calls, sold gilts to meet them, and pushed yields higher still. The Bank of England had to step in and buy.

  • Nobody’s view of the British economy changed that fast. The price of money did.
  • An interest rate is not a number on a screen. It is the price that reprices everything you own.

3 · Supply and demand for loanable funds

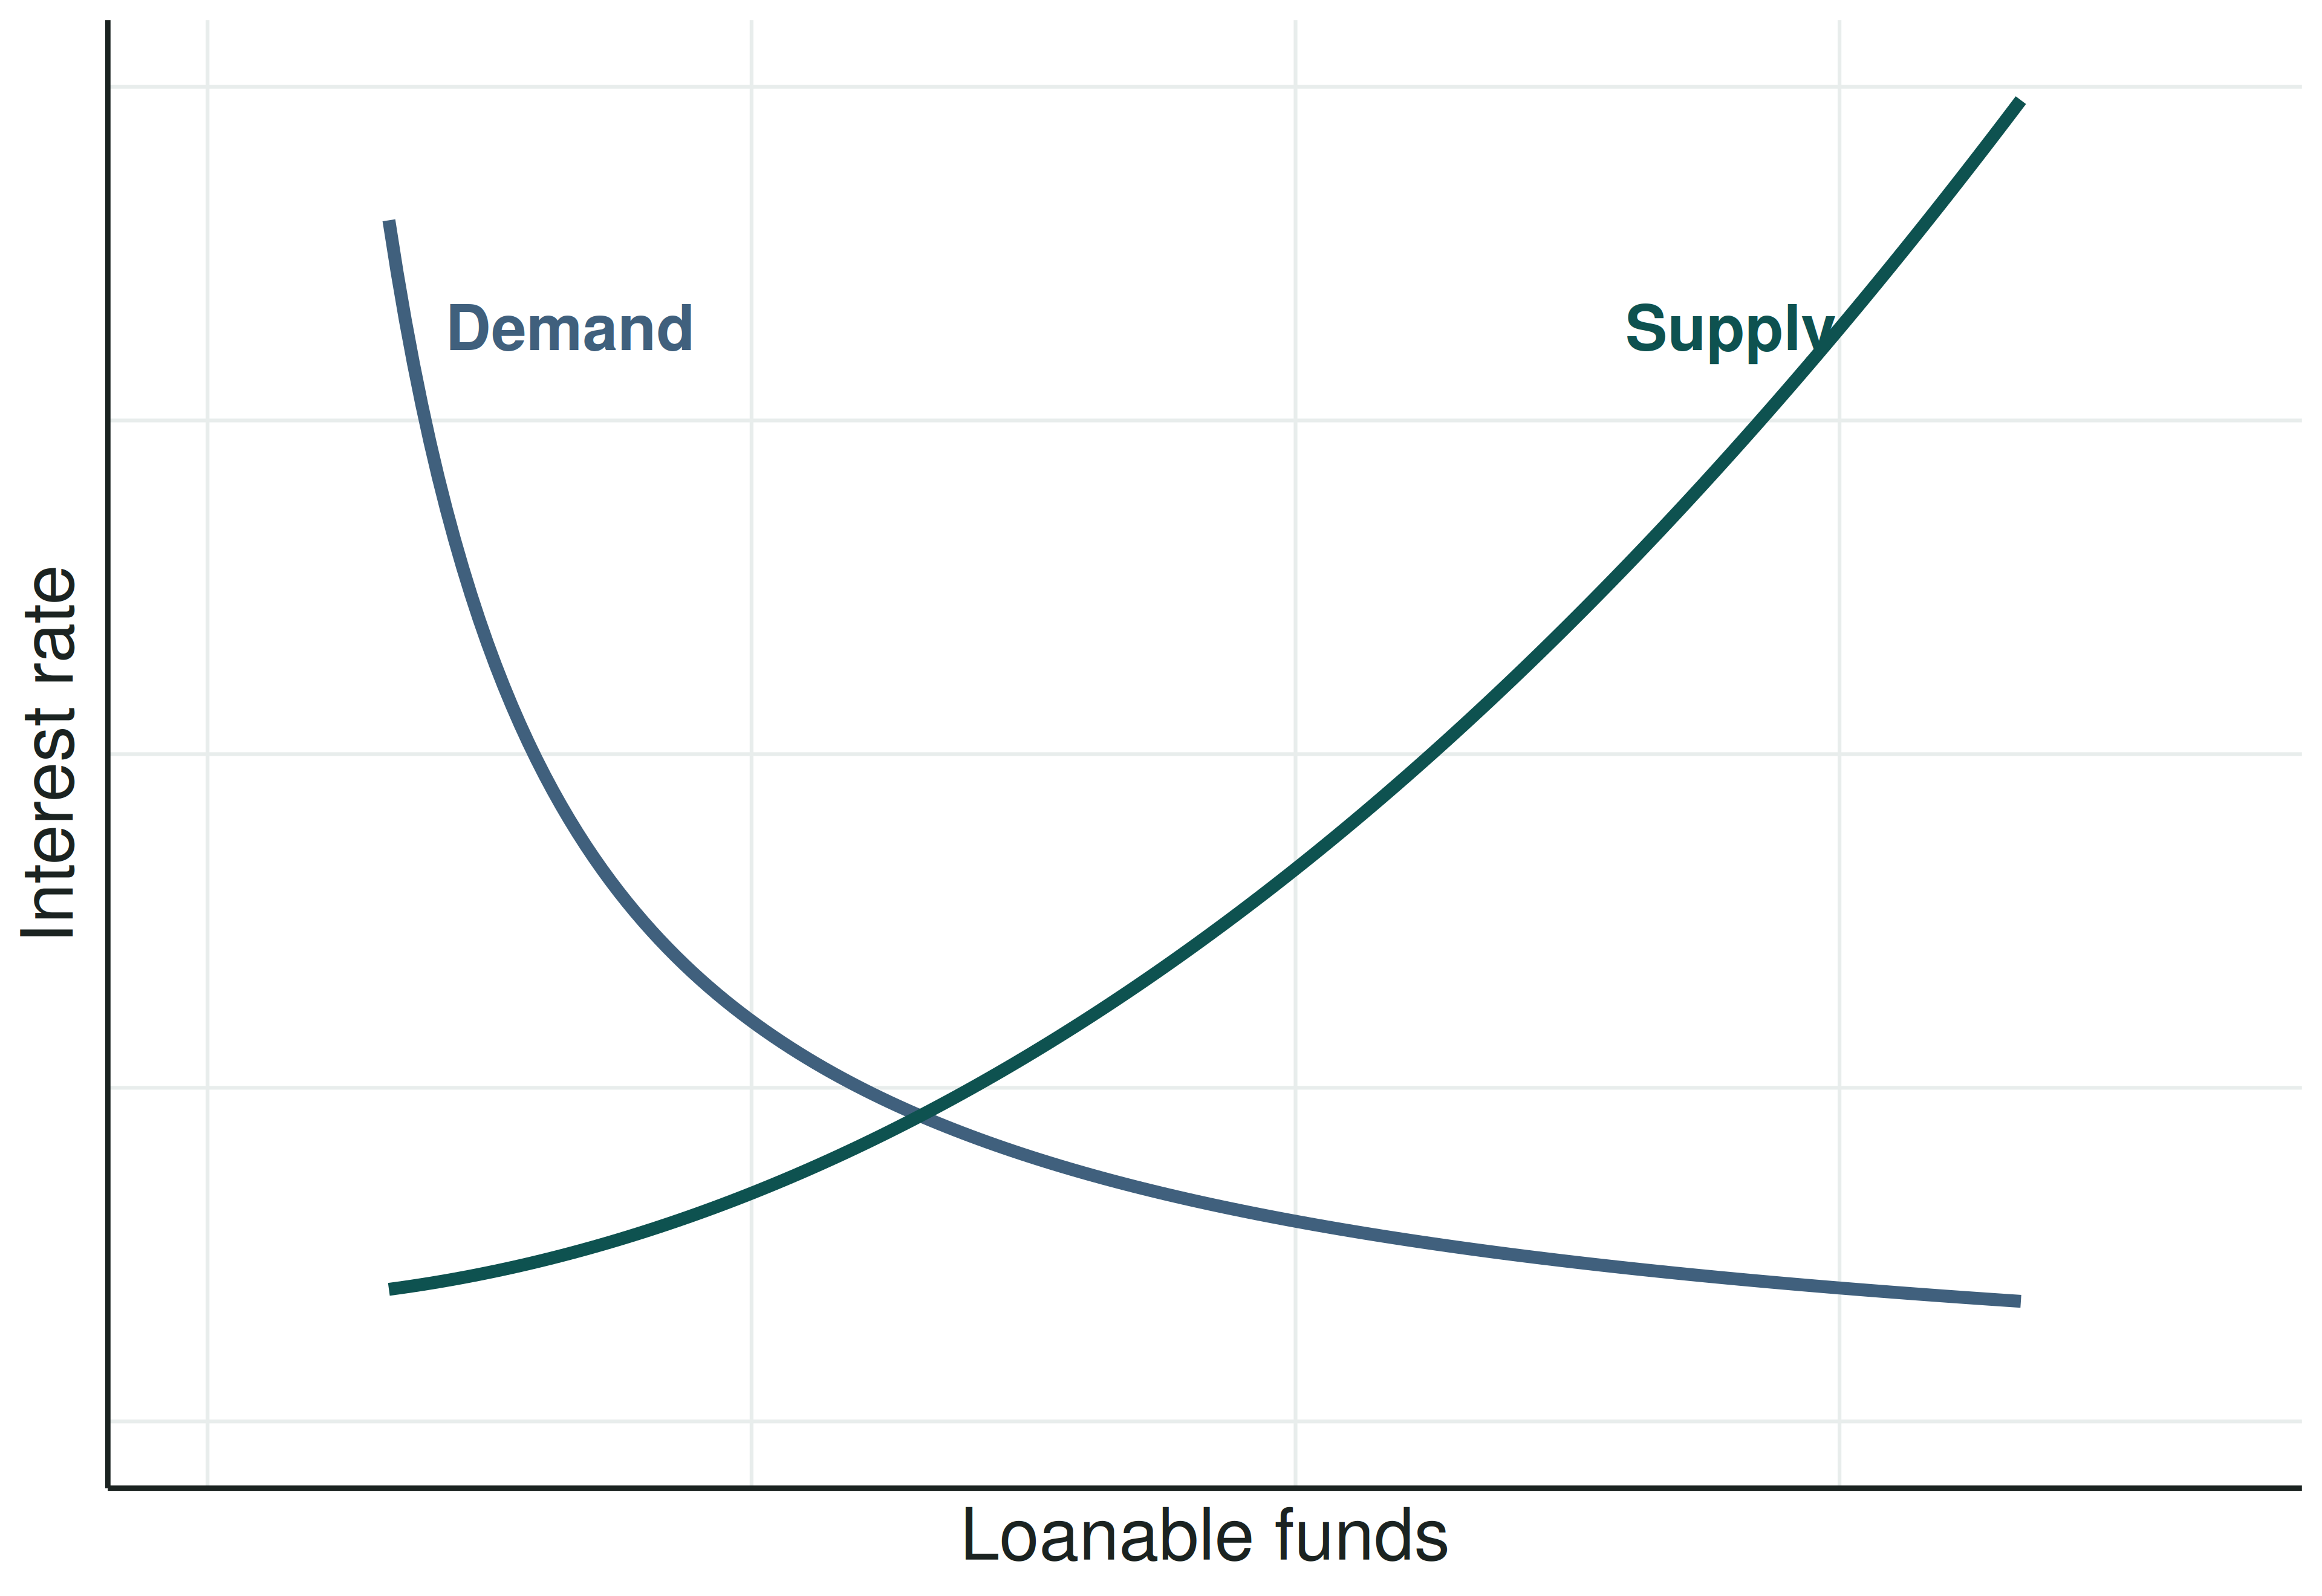
The interest rate is the price that clears the market for loanable funds.

Everything in the next two slides is a shift of one of these two curves. Ask yourself which one, and in which direction.

3 · What shifts the supply of funds

  • Wealth of fund suppliers rises (households, businesses) → more available for investment
  • Risk of the security falls — lower probability of issuer default → securities more attractive to suppliers
  • Near-term spending needs fall → more available for investment
  • Monetary expansion by the central bank → more funds available
  • Economic conditions improve (inflation, unemployment, growth) → the flow of funds to the country increases

3 · What shifts the demand for funds

  • Utility from assets bought with borrowed funds rises → market participants borrow more
  • Non-price conditions on borrowing become less restrictive → borrowing increases
  • Economic conditions improve — a period of growth → borrowing increases

The ECB’s 2022–2023 hiking cycle: which curve moved, which way, and did the quantity of loanable funds rise or fall? (The rate going up does not settle it.)

3 · The interest rate over the business cycle
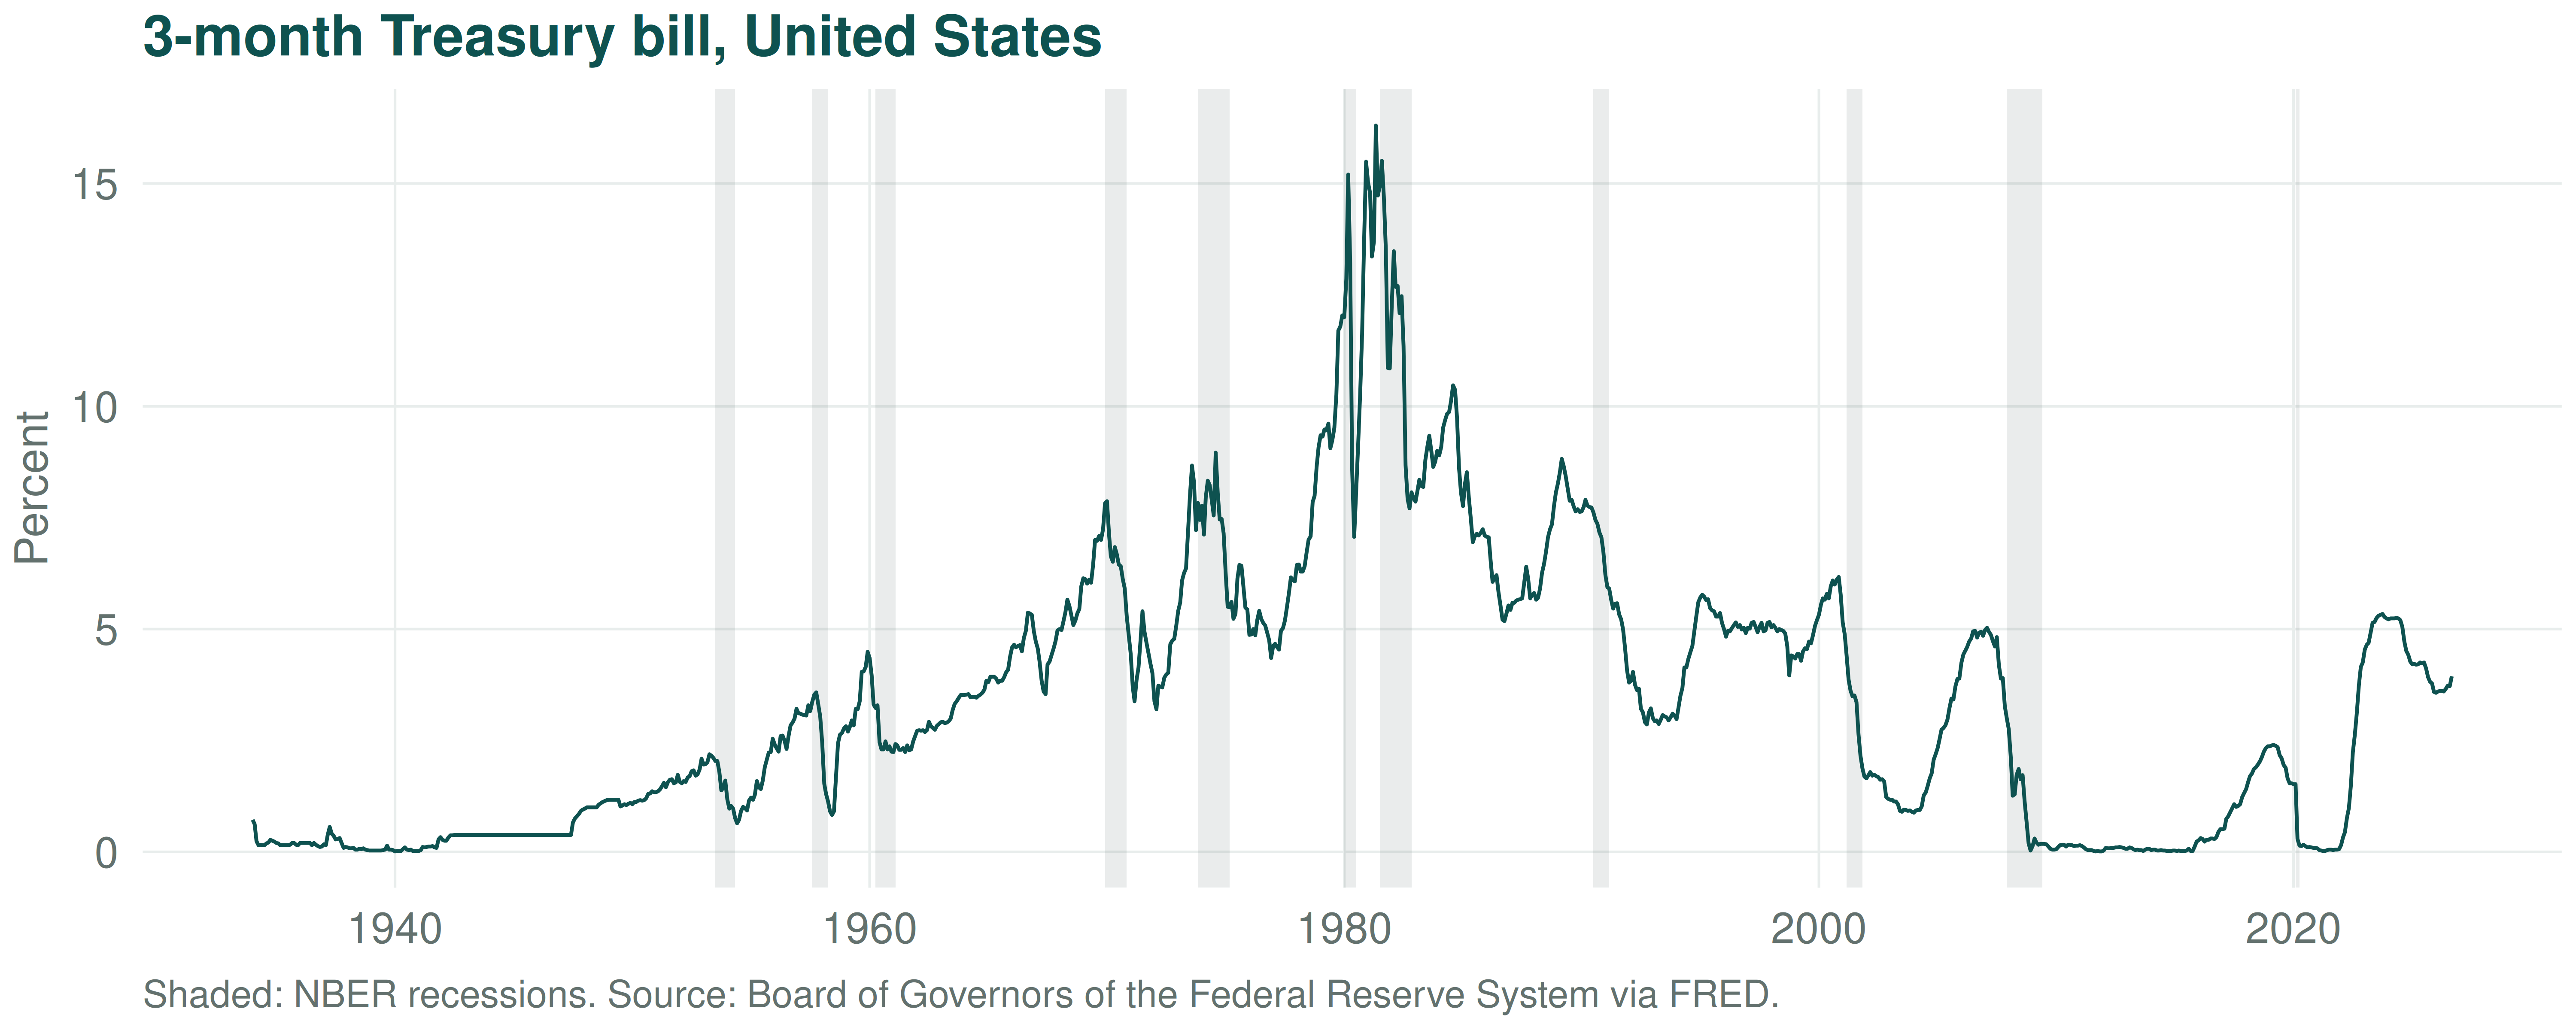
What is the relationship between the business cycle and interest rates — and which way does the causality run?

3 · The interest rate and the CPI
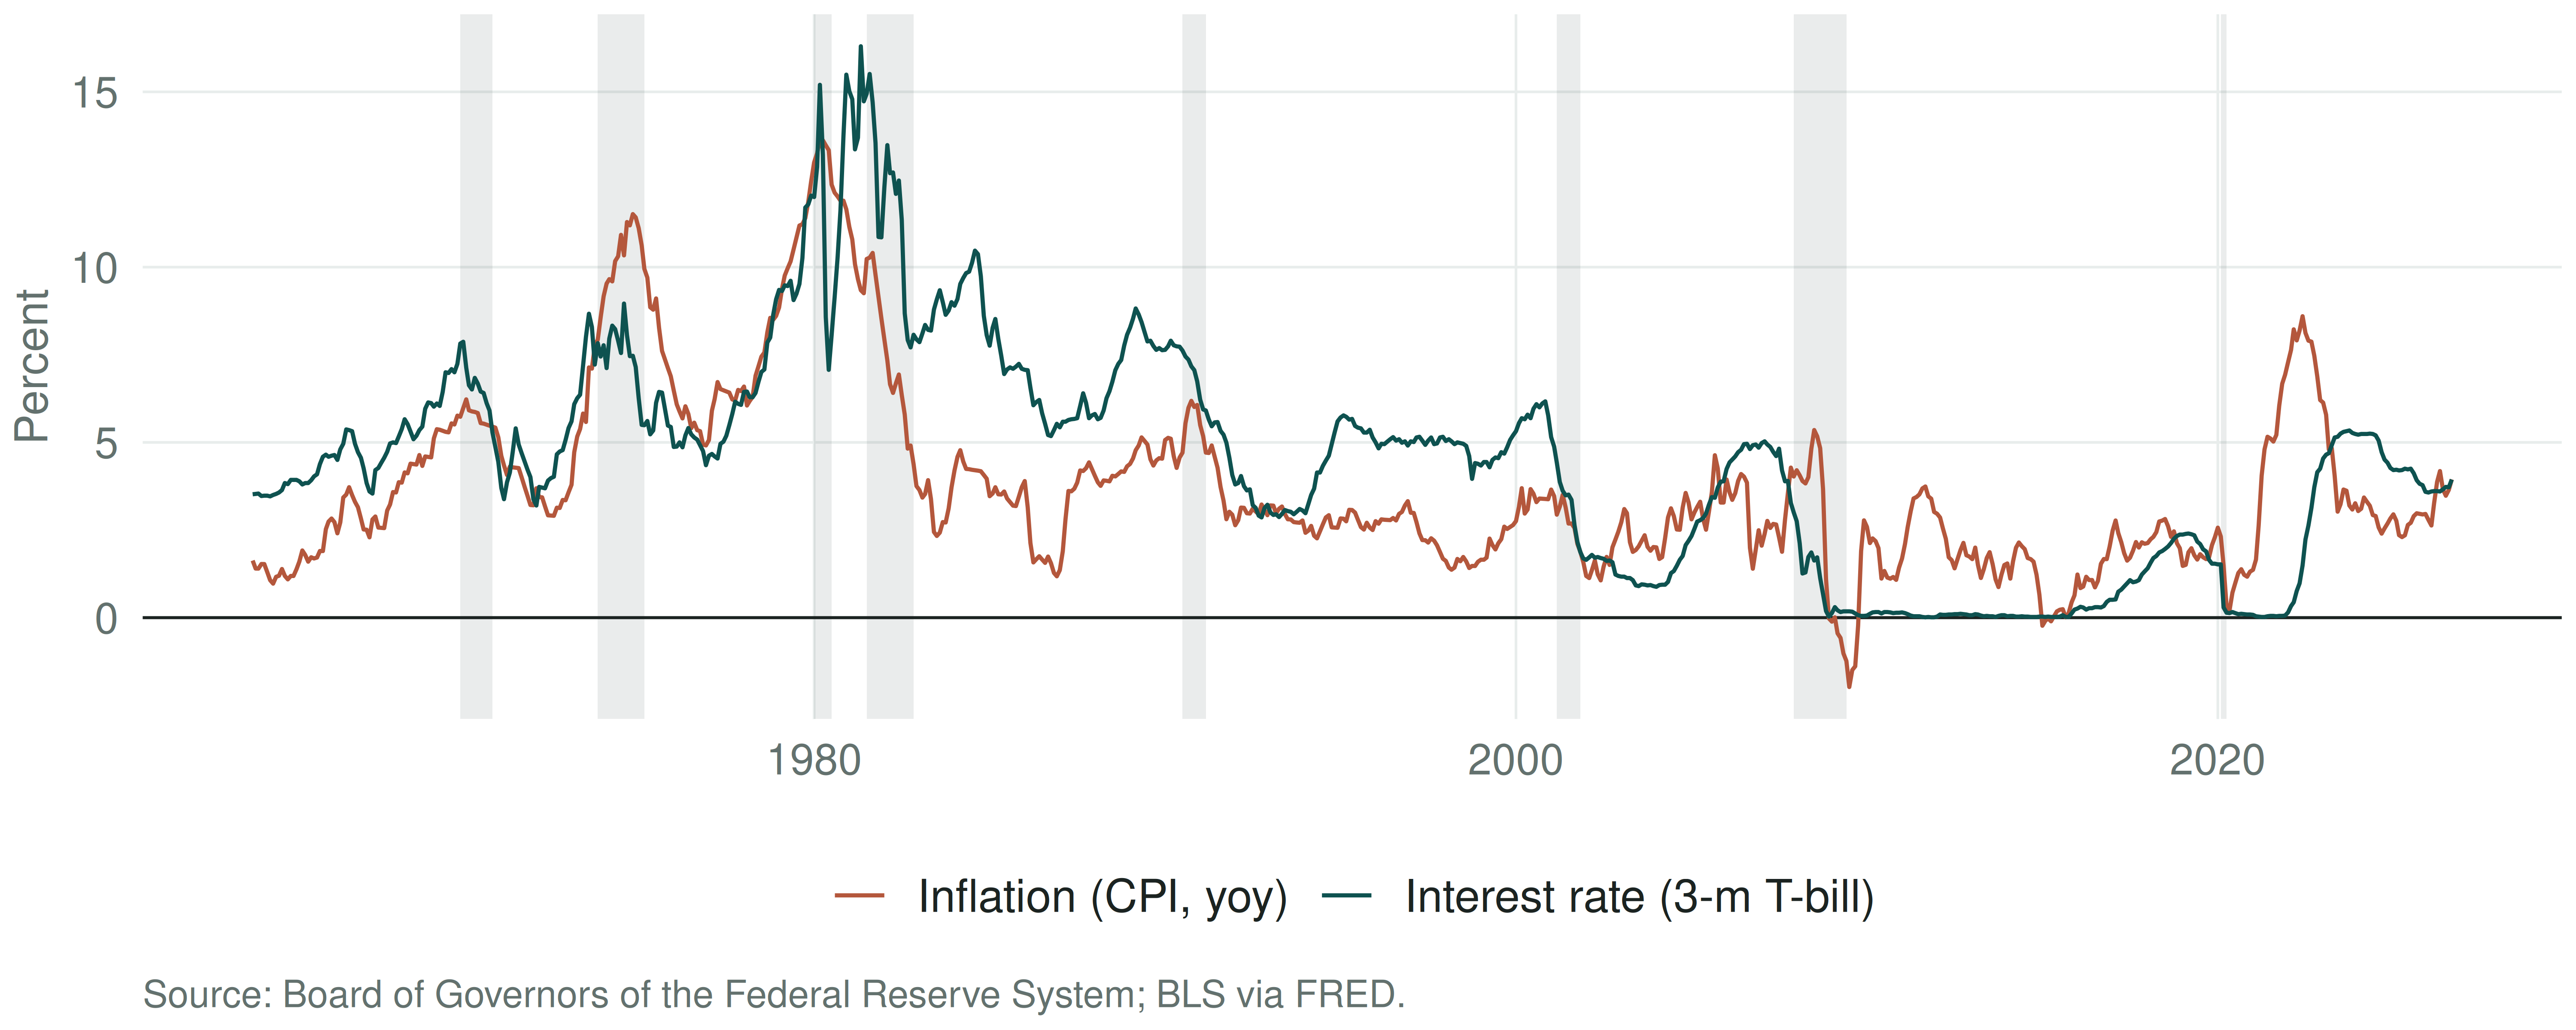
What is the relationship between the interest rate and the CPI?

3 · Real and nominal

i_r = i - \pi^e The real rate is the nominal rate adjusted for expected changes in the price level. It reflects the true cost of borrowing.
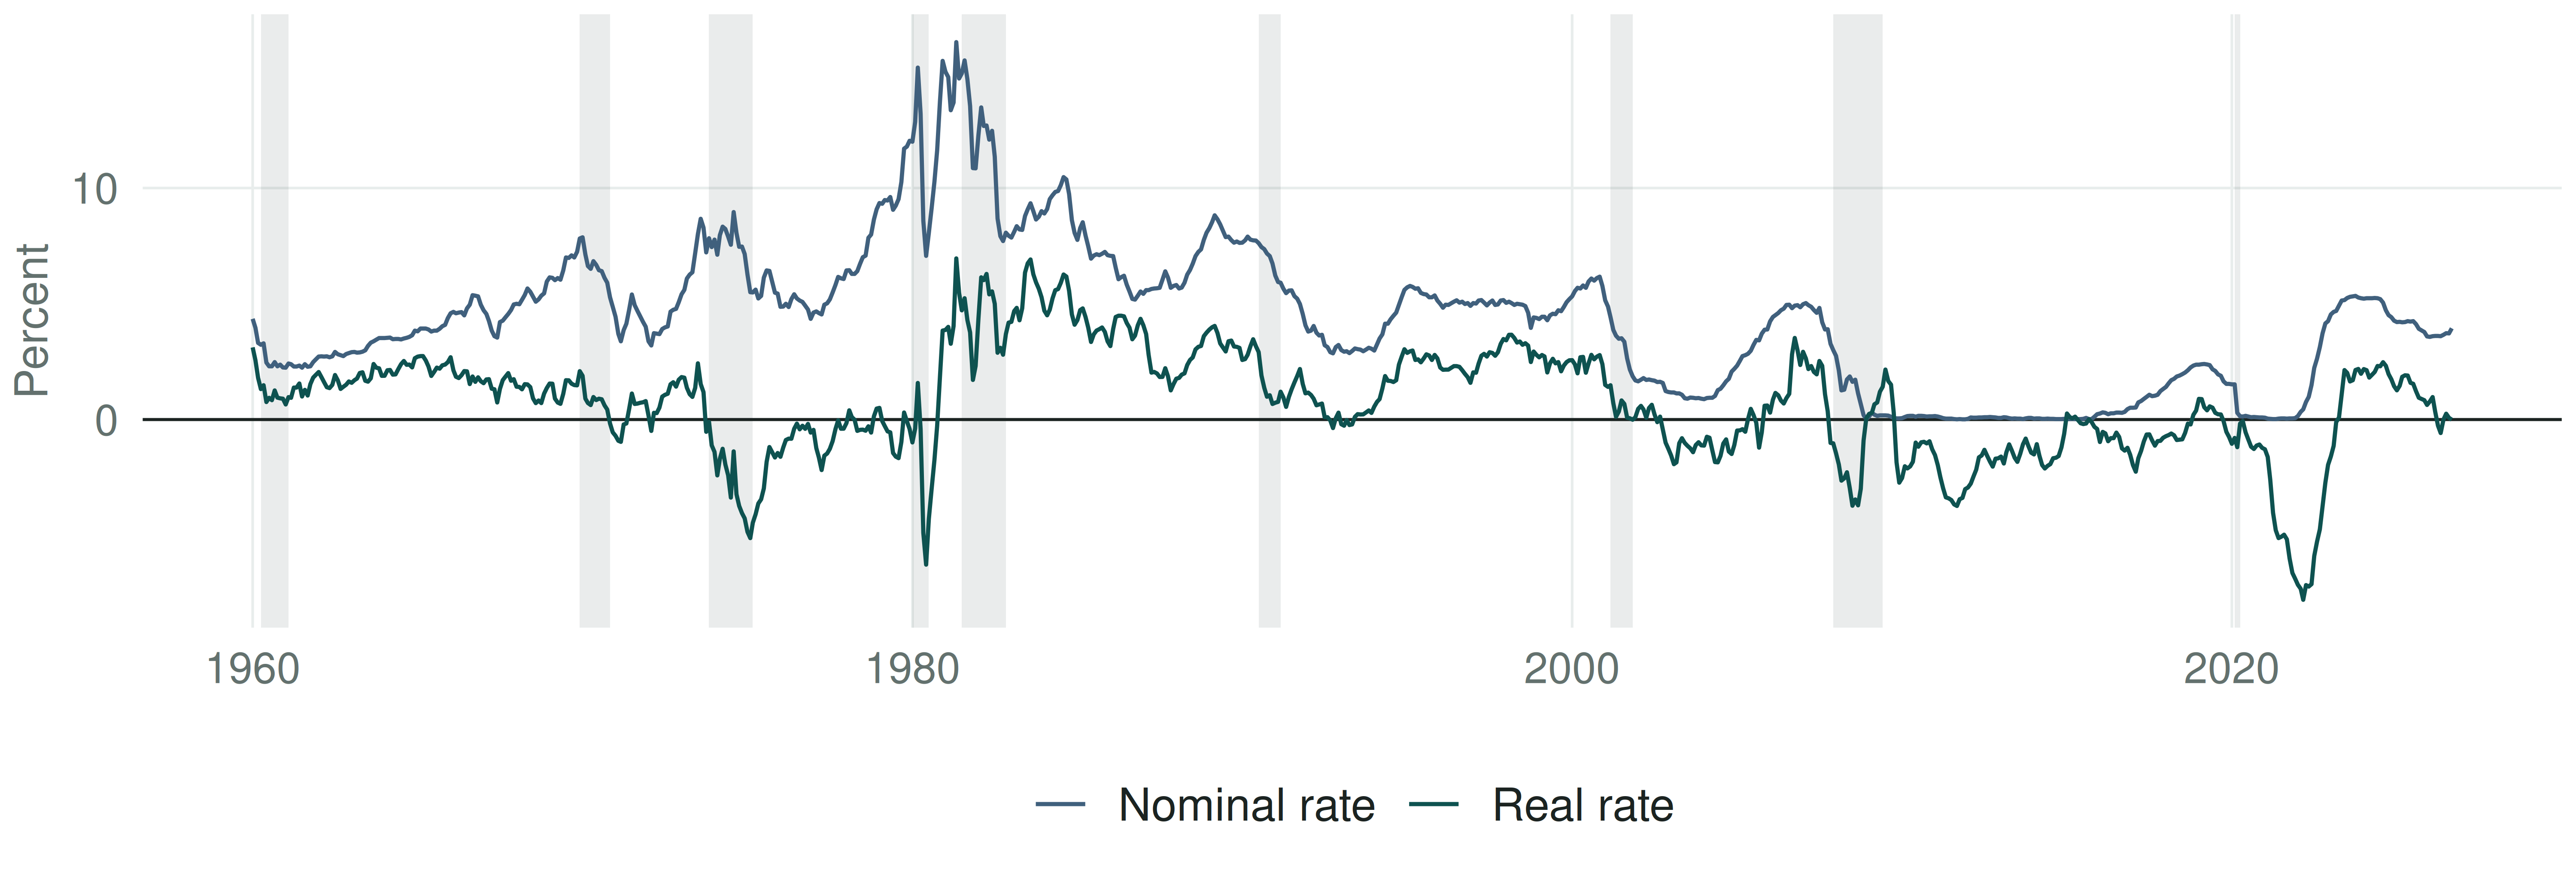
When the real rate is low, borrowing looks clever and lending looks foolish. Find the stretches where it was negative — someone was quietly transferring wealth to someone else. Who, and to whom?

3 · Risk and term structure

The risk that the issuer is unable or unwilling to make interest payments as promised. Bonds with no default risk — U.S. Treasuries, which can raise taxes or print money — are the benchmark. The risk premium is the spread between a bond with default risk and a default-free bond.

A liquid asset is quickly and cheaply converted into cash. Demand is higher for more liquid assets, so the premium reflects both default risk and liquidity.

Tax exemption acts like an increase in expected return. U.S. municipal bonds are exempt from federal income tax; Treasuries are exempt from state and local income tax.

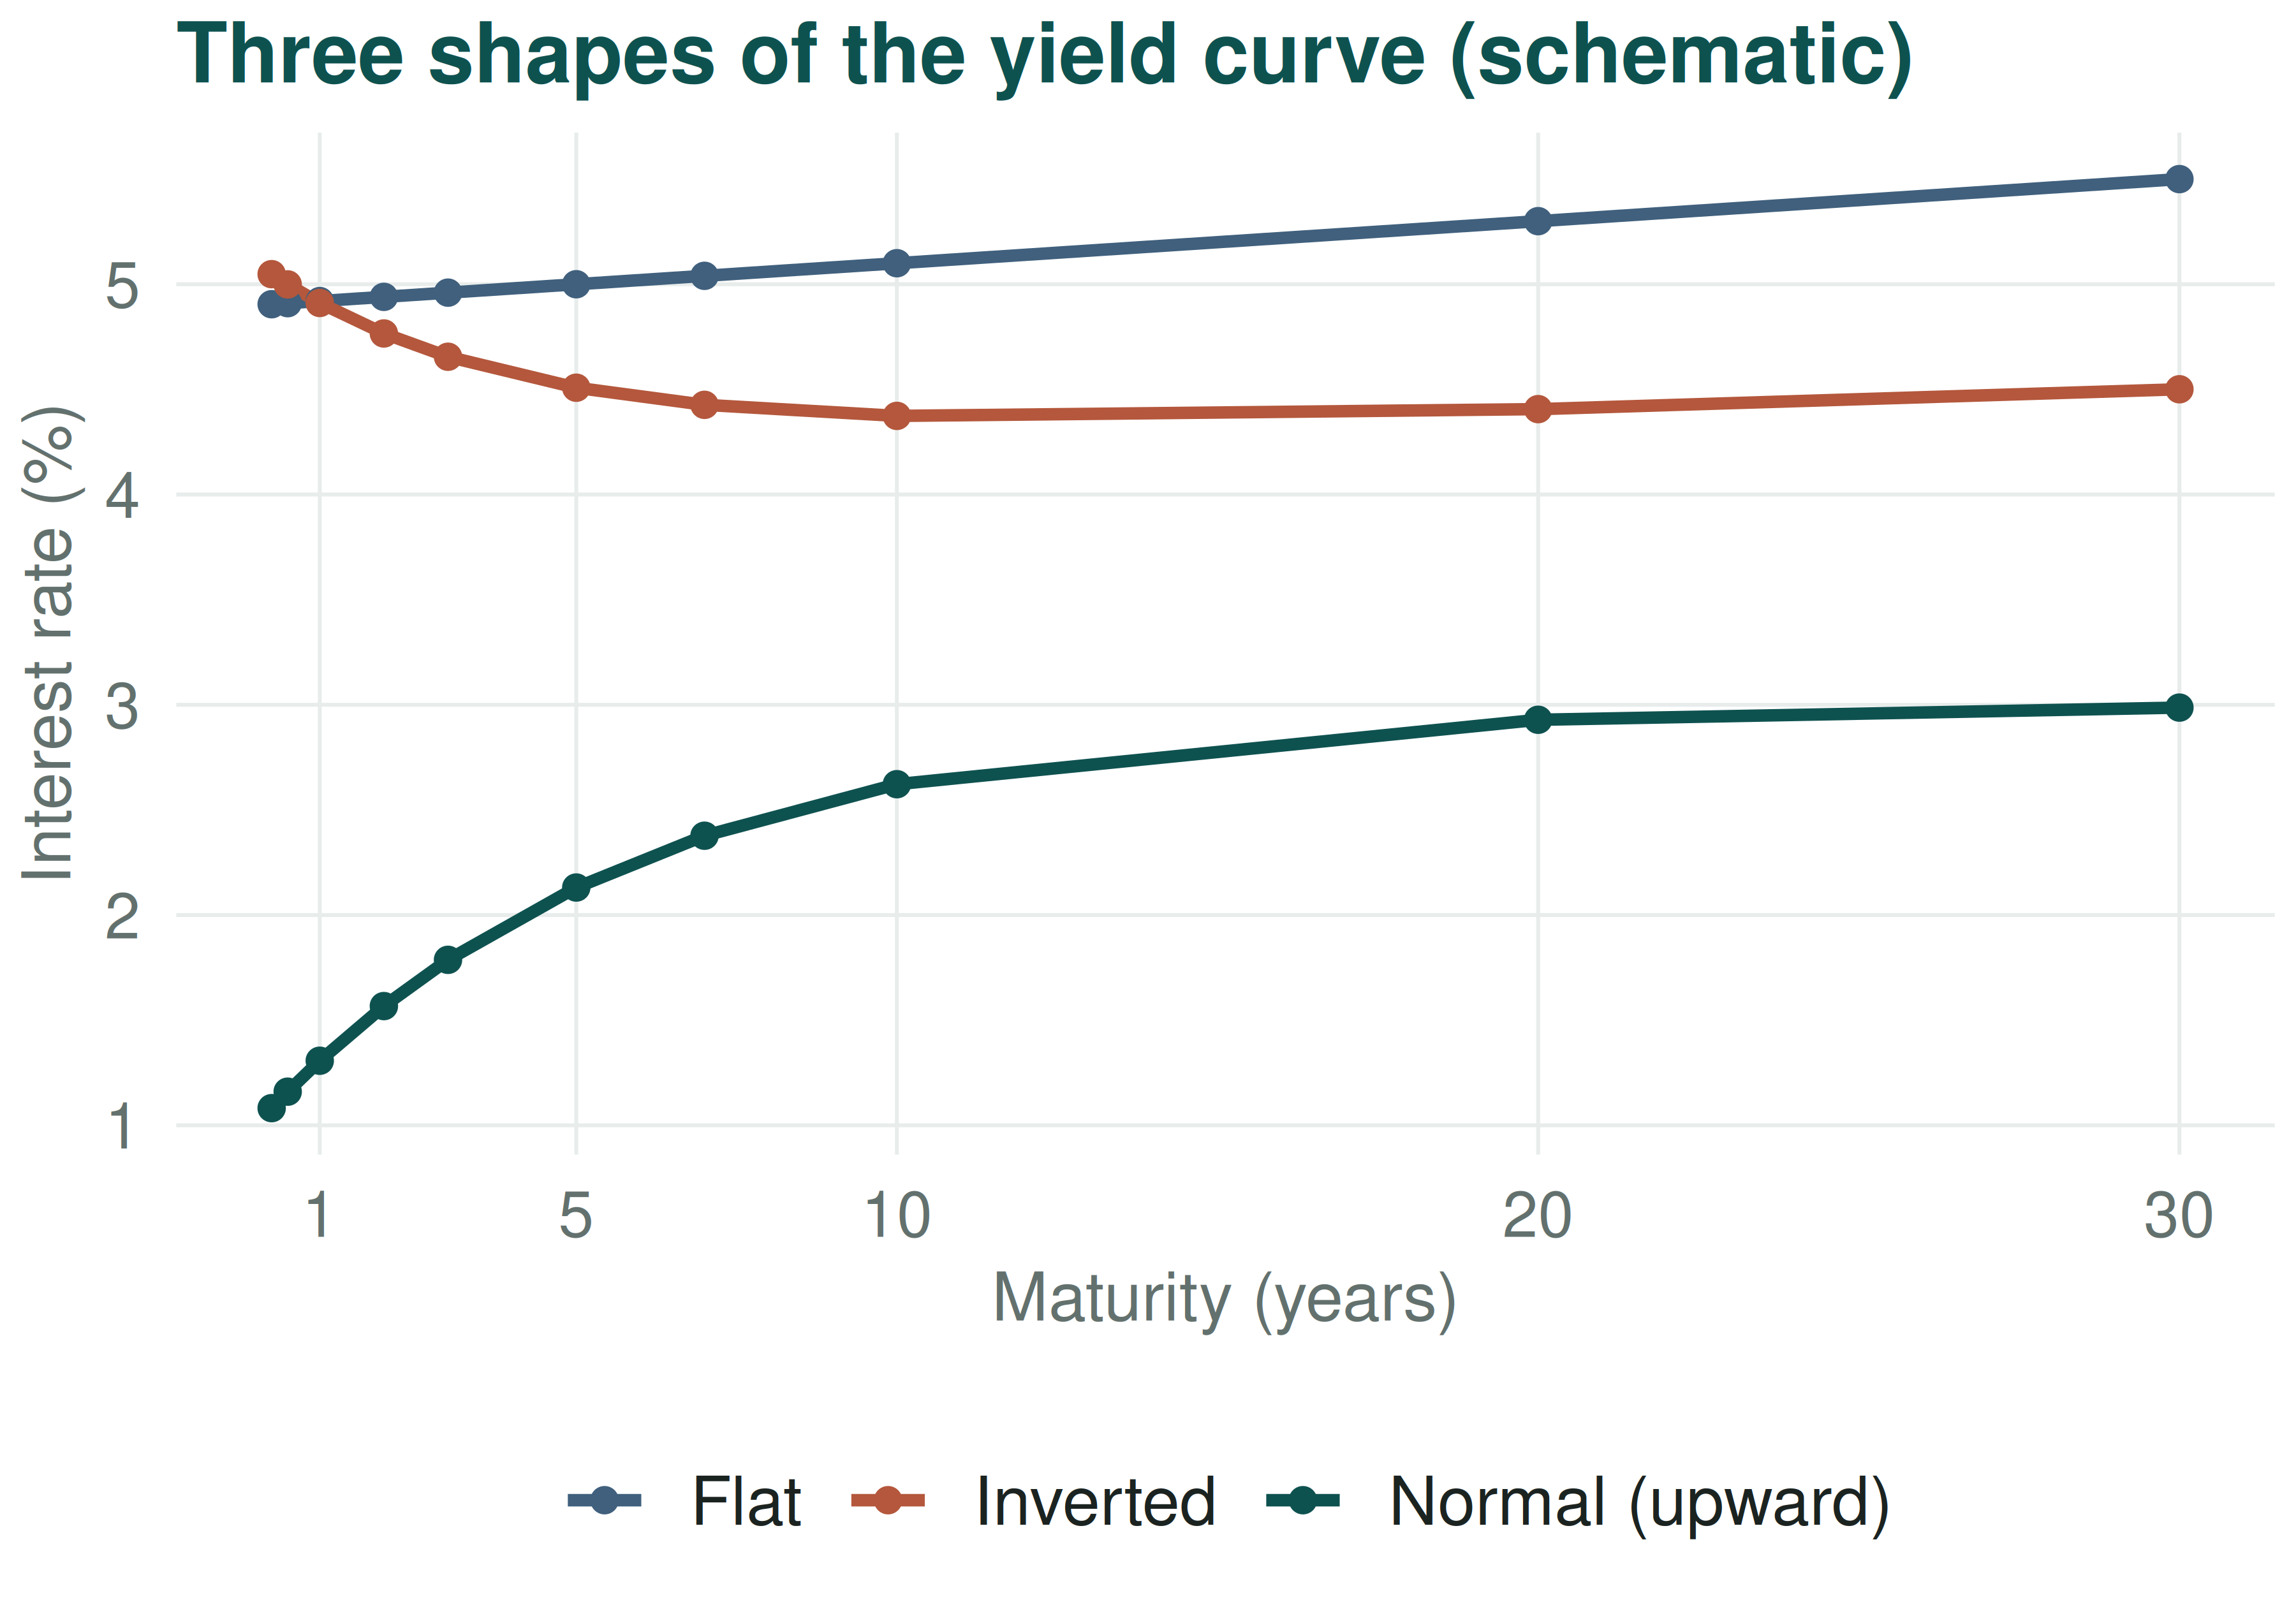
Rates at different maturities move together. When short rates are low, yield curves tend to slope steeply upward; when short rates are high, the curve tends to slope gently downward. Most of the time it slopes upward.

3 · Yield curves

Most of the time the curve slopes upward. The two other shapes are the interesting ones.

An inverted curve has preceded most U.S. recessions. Does that make it a forecast, or a symptom?

Live curve: U.S. Treasury daily yield curve rates. Pull the current one before class — the shape today is the best slide you have.

4 · The exchange rate

15 January 2015

For three years the Swiss National Bank had promised it would not let the franc strengthen past 1.20 per euro. That morning, it stopped. The franc jumped by roughly a fifth against the euro within the day, and several retail FX brokers did not survive the week.

  • A fixed exchange rate is a promise, and a promise is worth exactly the reserves standing behind it.
  • Section 4: who makes the promise, what it costs to keep, and what happens on the day it breaks.

photo idea: the EUR/CHF chart of 15 Jan 2015, or a Swiss franc note — search “EURCHF january 2015 chart”

4 · Exchange rate regimes

Regime Definition In favour Against
Fixed Rates held constant or fluctuating within very narrow boundaries MNCs operate more easily Government may alter the value of a currency
Free float Rates determined by market forces, no intervention Problems in one country spread less easily; no intervention policy needed; market efficiency enhanced MNCs must manage the exposure; countries with severe problems may struggle
Managed float Market forces with government intervention Governments manipulate the rate for their own benefit
Pegged Home currency pegged to a foreign currency or unit of account Hard to defend against speculators in a crisis
No national currency The country uses another currency, e.g. the U.S. dollar

4 · Exchange rate policy

  • The spot market is the immediate purchase or sale of foreign exchange. S(j/k) is the price of one unit of currency k in terms of currency j.
  • The exchange rate is the result of national currency supply and demand: the price of a currency in terms of another.
  • Exchange rate policy is a component of economic policy. Authorities can defend the rate by
    • fixing short-term interest rates to prevent capital flight,
    • buying and selling on the foreign exchange market,
    • controlling exchanges through quantitative restrictions on capital movements.

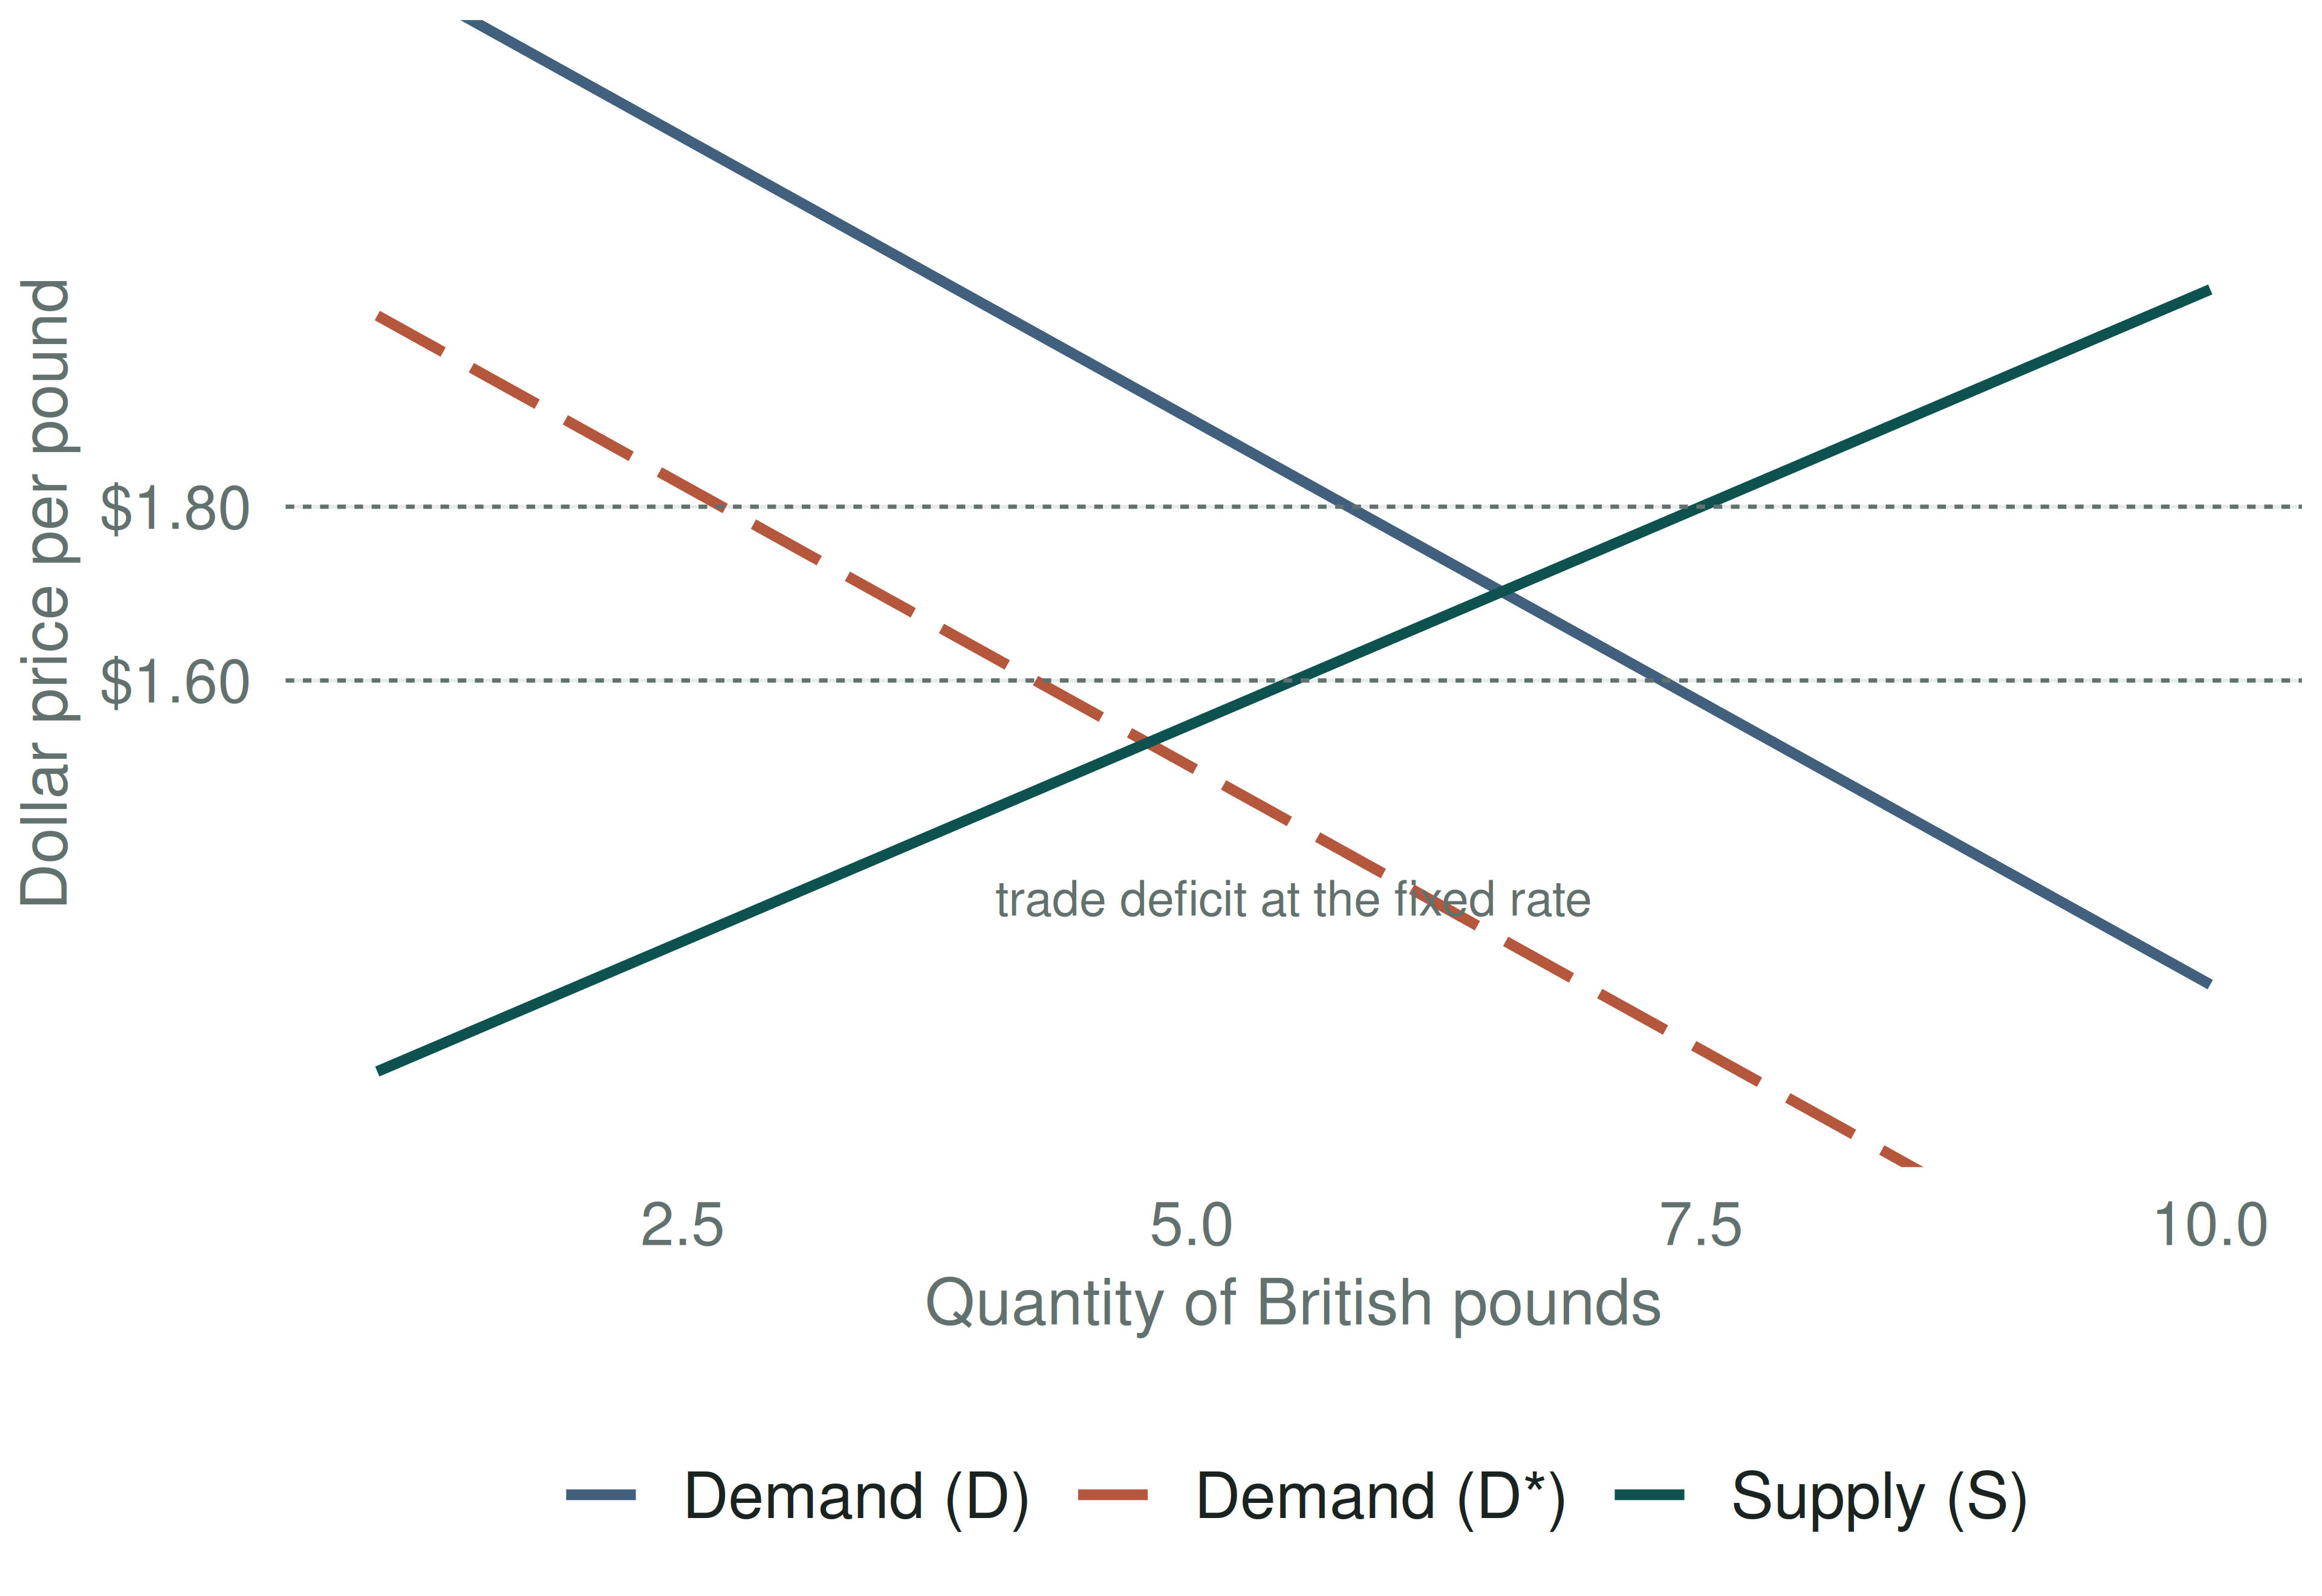
4 · Fixed versus flexible: the pound market

The rate starts at 1.60 $/£ and the U.S. runs a trade deficit.

  • Flexible: the dollar depreciates to 1.80 $/£ and the deficit disappears.
  • Fixed: the rate stays at 1.60 and the Fed supplies pounds out of reserves — or runs contractionary policies to shift demand back.
4 · The Mundell–Fleming model

A small open economy with perfect capital mobility, so i = i^{*}.

IS — goods market, for a given i^{*}:

Y = C(Y-T) + I(i^{*}) + G + NX(e)

LM — money market, for a given i^{*}:

M/P = L(i^{*}, Y)

LM is vertical: given i^{*} only one Y clears the money market, whatever e. That single fact drives every result on the next slide.
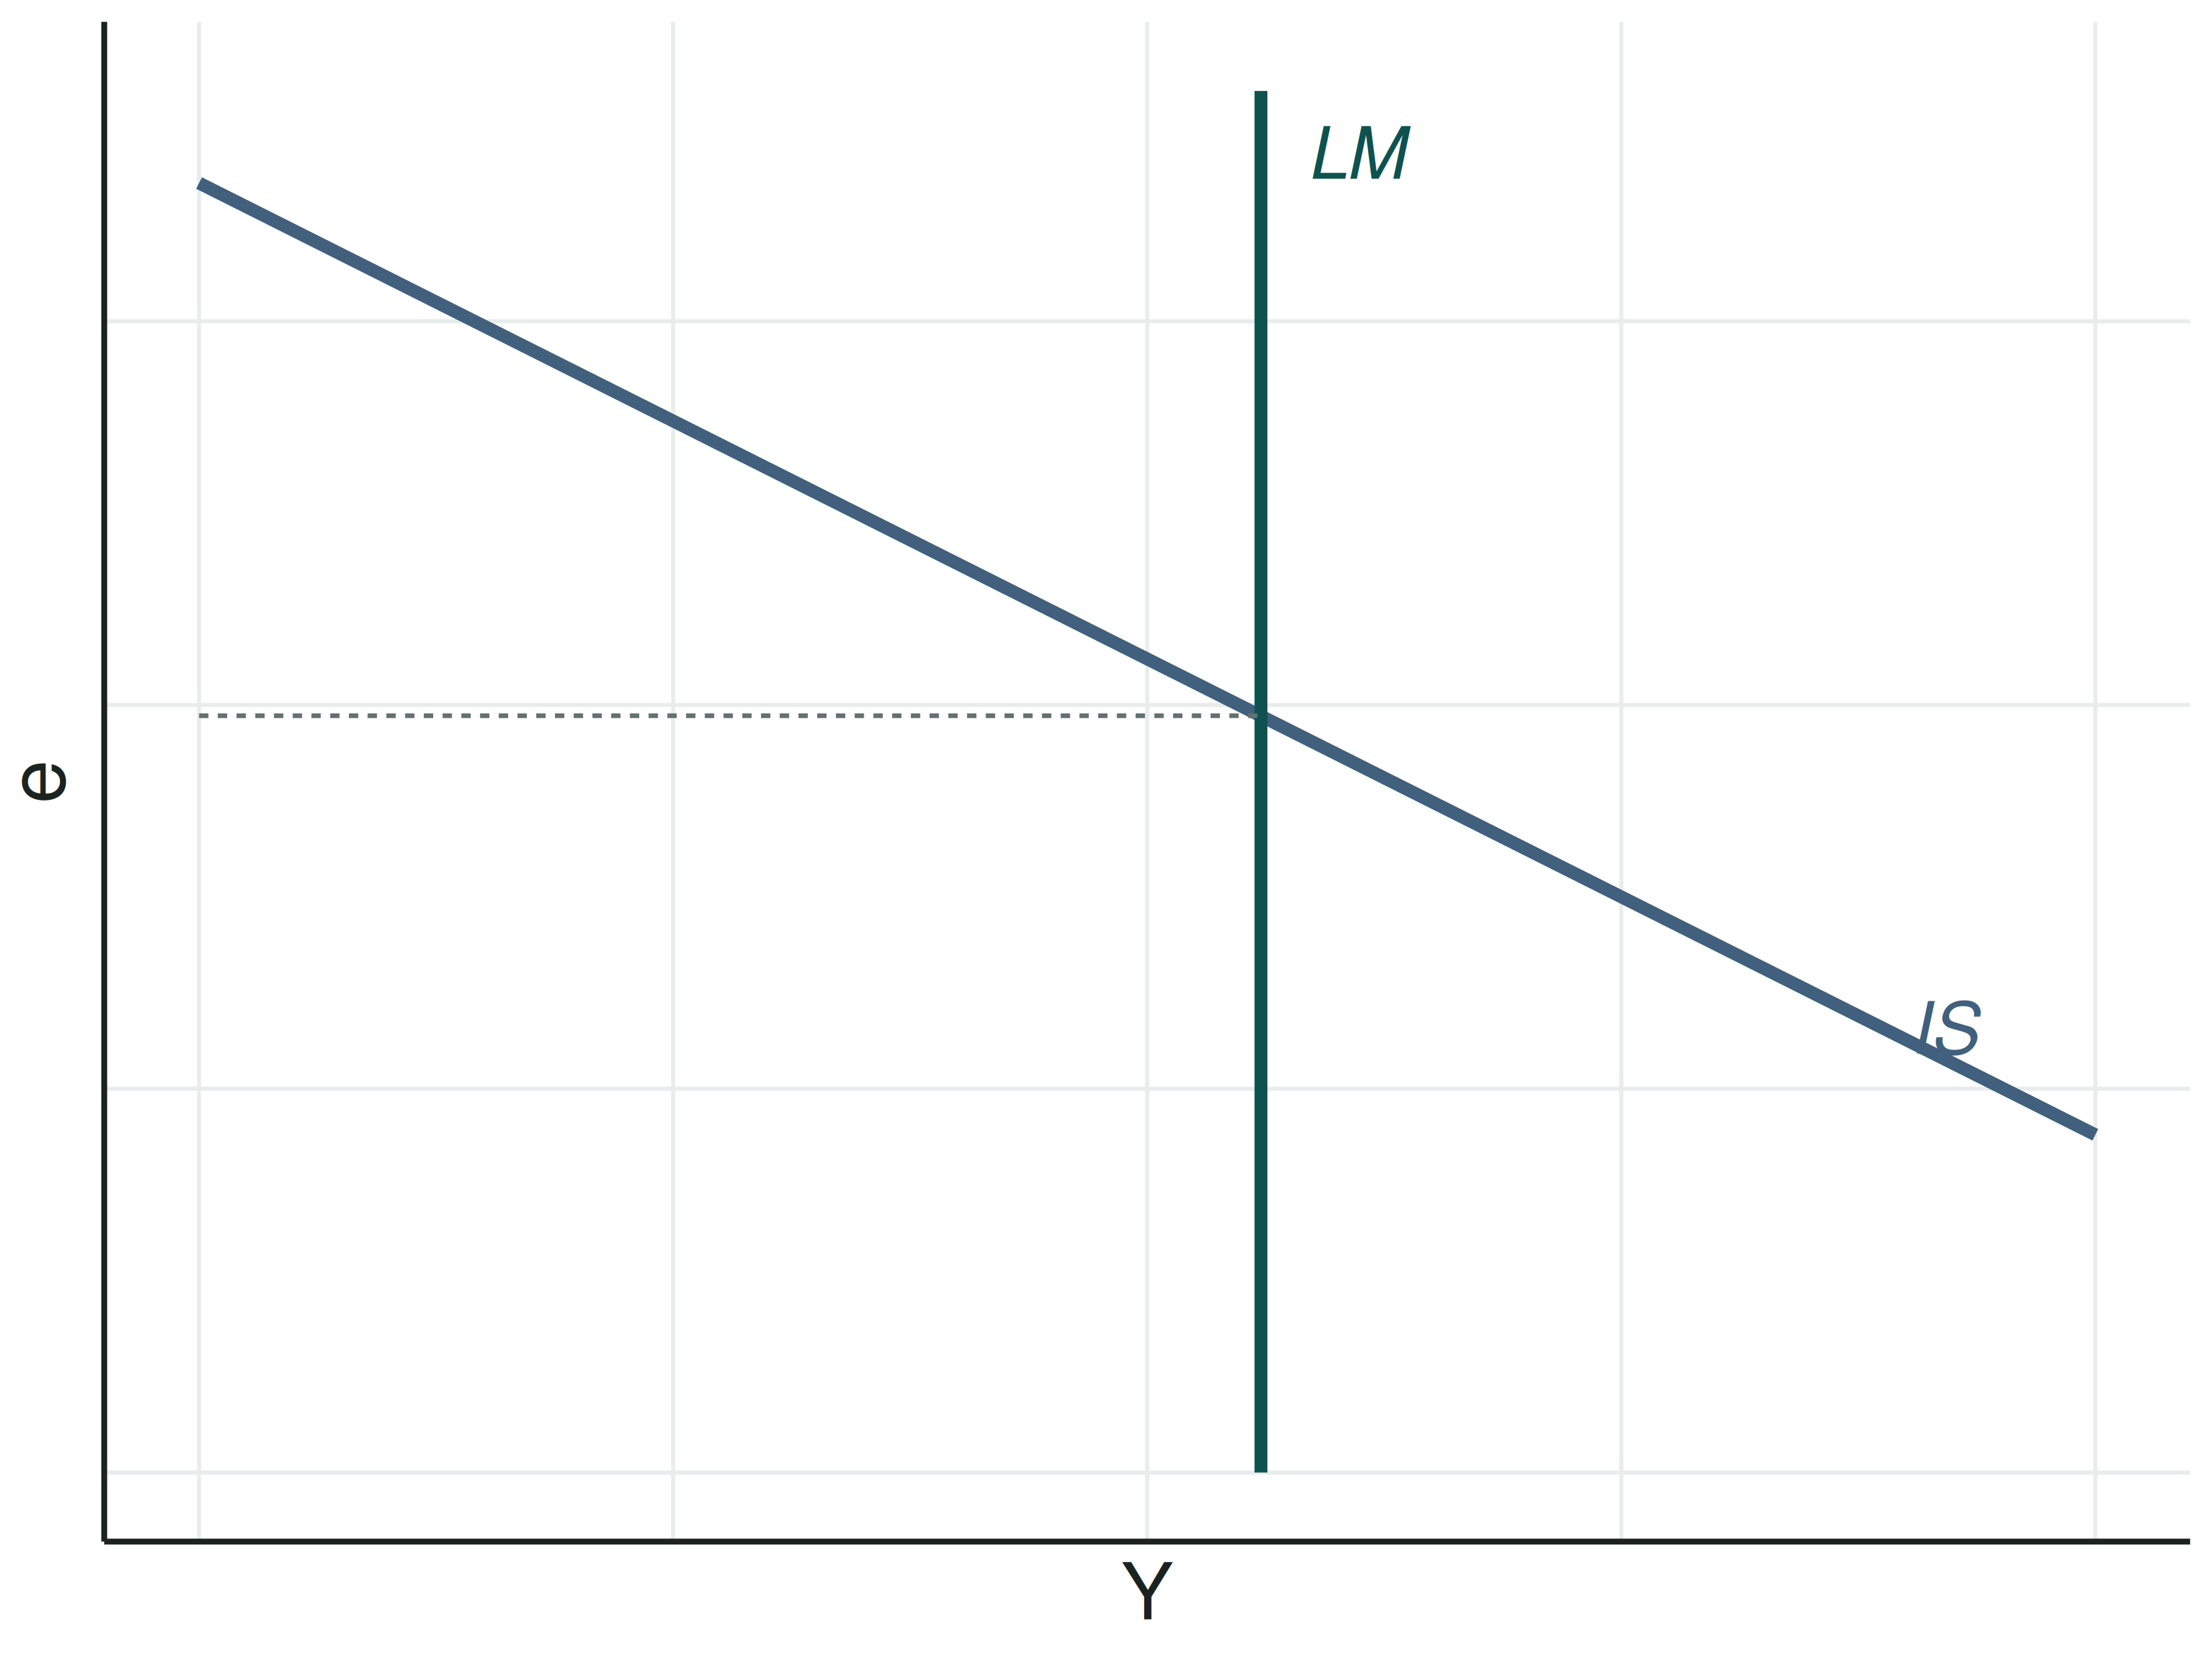
e = nominal exchange rate, foreign currency per unit of domestic currency.

4 · Problem 1.3 — policies in the Mundell–Fleming model

What is the consequence of a fiscal expansion, a monetary expansion and a trade restriction on the exchange rate and on output — under floating and under fixed rates?

Policy Floating: e Floating: Y Fixed: e Fixed: Y
Fiscal expansion
Monetary expansion
Import restriction

Fill the table with them — press C and draw the IS and LM shifts for each row before writing the sign.

4 · Currency supply and demand

Domestic currency supply Domestic currency demand
Private sector Purchase of foreign goods and services (imports) Purchase of domestic goods and services (exports)
Income paid on non-residents’ investments here Income received on residents’ investments abroad
Unilateral transfers out Unilateral transfers in
Net purchase of foreign assets by residents (capital outflow) Net purchase of domestic assets by non-residents (capital inflow)
Foreign debt repayment (cash outflow) Settlement of foreign credit (cash inflow)
Central bank Foreign currency purchased (reserves increase) Foreign currency sold (reserves decrease)

4 · Central bank intervention

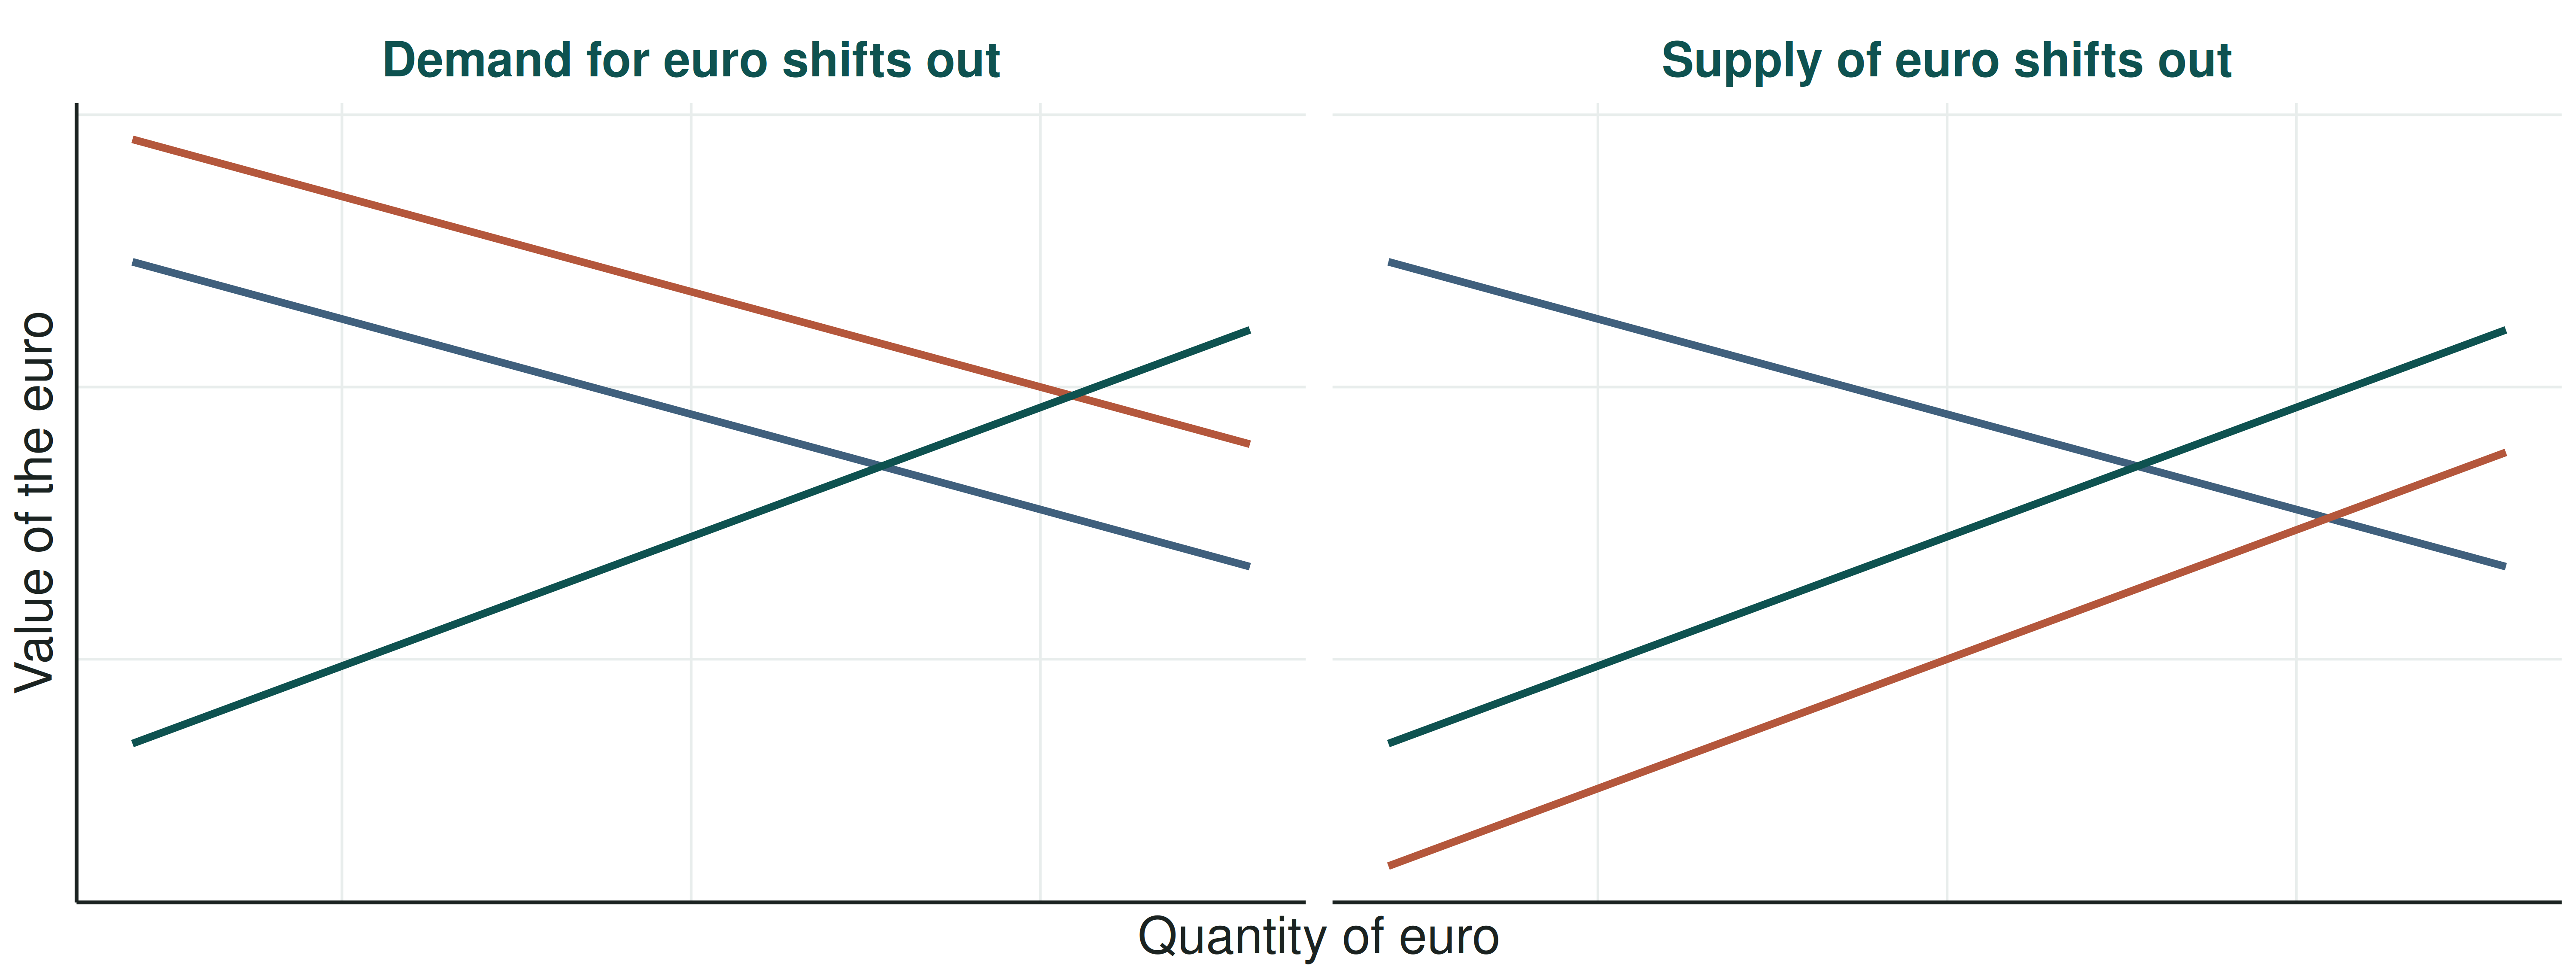
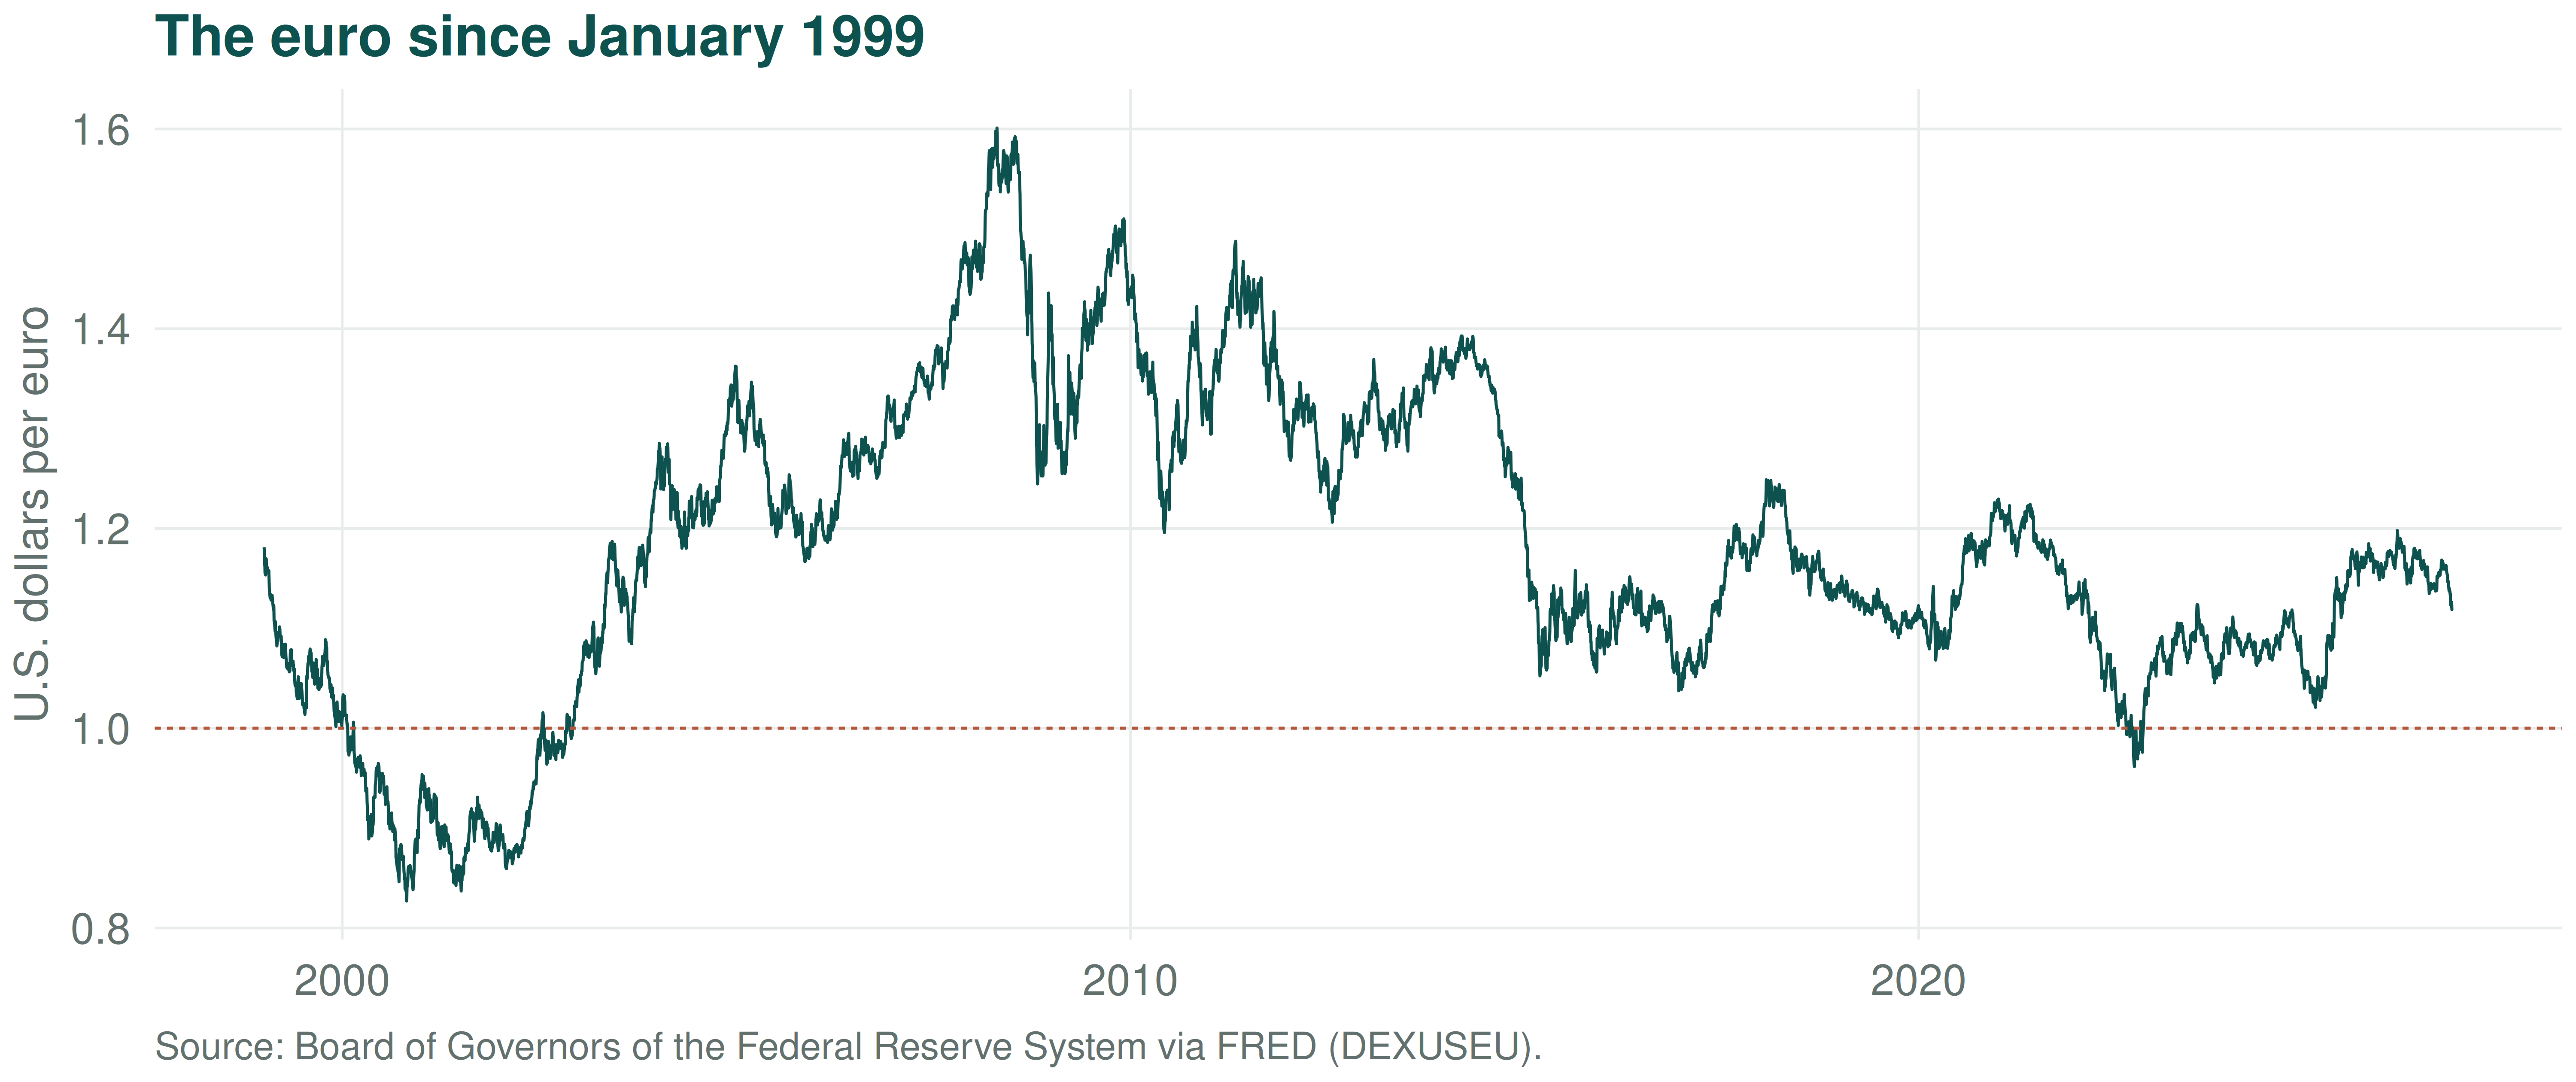
What is the ECB’s intervention in the foreign exchange market in each of these two situations?
4 · The euro against the dollar
4 · The Asian crisis (1)

  • In 1997–98 Thailand was at the centre of a financial crisis.
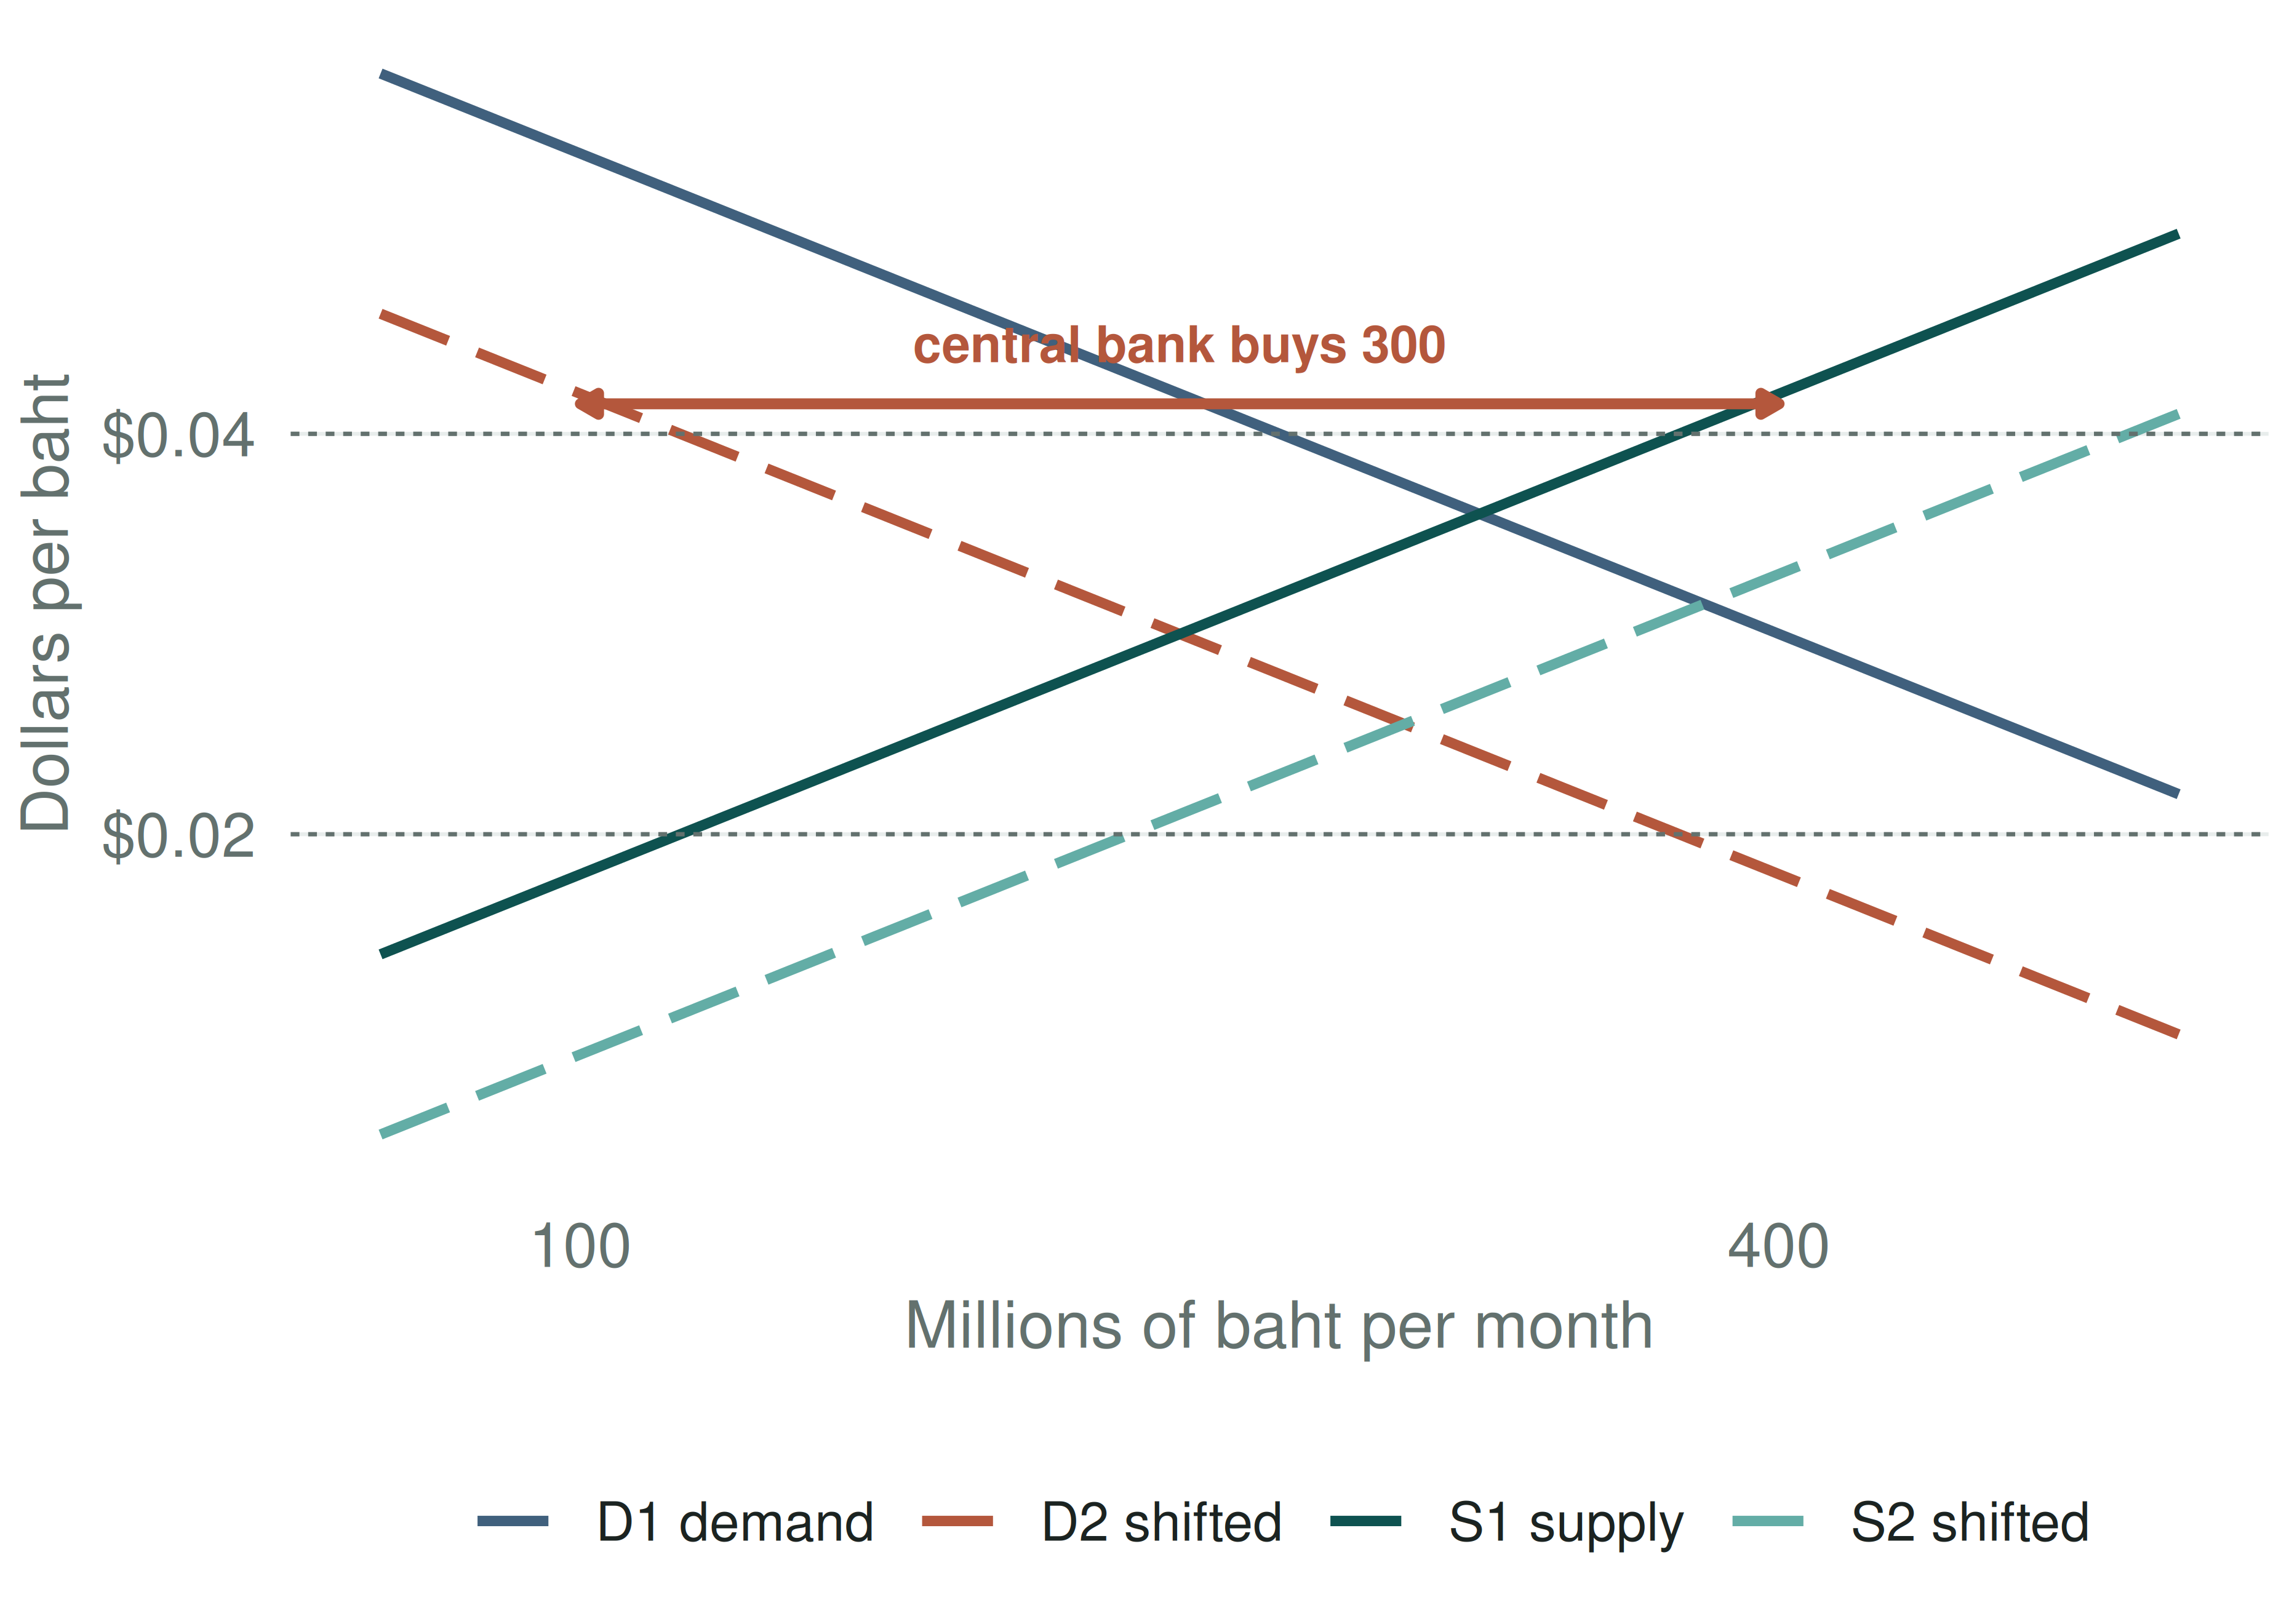
  • It began with a loss of confidence in the Thai financial system: the supply and demand curves for baht shifted, the equilibrium rate fell, but Thailand kept the actual rate fixed at $0.04 — above equilibrium.
  • The central bank depleted its dollar reserves defending it, which led traders to anticipate a devaluation and shift the curves further.
  • In July 1997 it ran out of reserves and let the baht float. It fell immediately from $0.04 to $0.02.
  • Thai banks, counting on the fixed rate, had borrowed heavily in dollars and yen and lent in baht. That currency mismatch is the crisis.

How did the Thai central bank maintain the fixed rate — and why did it try?

4 · The Asian crisis (2)

At the fixed rate of $0.04, once the equilibrium has fallen to $0.02, the central bank must buy 300 million baht a month with dollars.

  • Once reserves are gone there are two choices: float (immediate depreciation) or declare a new, lower fixed rate — a devaluation.
  • Speculators anticipate the drop, which lowers the equilibrium value further and increases the excess supply of baht.
  • Defending the rate gets harder the longer you defend it.
5 · Reading discussion

The tragedy of the horizon

Mark Carney, at Lloyd’s of London in 2015: the costs of climate change fall beyond the horizon of the business cycle, the political cycle and the investment cycle.

By the time it is unambiguously a financial risk, it is too late to treat it as one.

photo idea: flooded street, or a stranded coal plant — search “flooded street climate” or “abandoned coal power plant”

5 · Monasterolo (2020), Climate Change and the Financial System

(a) Why is there a misalignment between climate impacts and investors’ decisions?

(b) What are the various climate physical risks?

(c) What are the potential risks arising from policy and regulatory shocks?

(d) Why is assessing climate risks challenging?

  • Answer (a) with the horizons: the tragedy of the horizon — climate damages fall outside the investment and electoral cycle, so they are not priced.
  • For (c), separate an orderly transition from a disorderly one. The risk to a portfolio is the disorderly path, not the transition itself.
  • For (d), the honest answer is that the historical distribution does not contain the events we are pricing. That is a problem for every risk model in this course.

If climate risk is not priced because horizons are misaligned, which of the four sections of today’s session does the correction have to come through — markets, the balance of payments, the interest rate, or the exchange rate?

Next session

Sessions 3 and 4 move on to securities markets.

Two things to bring: Sartzetakis (2021) on green bonds, read — and the security your group wants to analyse. Not “a stock”. A specific one, with a ticker.

Press O for the slide overview · C to draw · S for speaker notes · F for fullscreen · E then print for a PDF of the slides.