International Finance
Session 5 — Financial Institutions and Firms: International Portfolio Investment
KEDGE Business School
October 2026
One portfolio, twelve countries
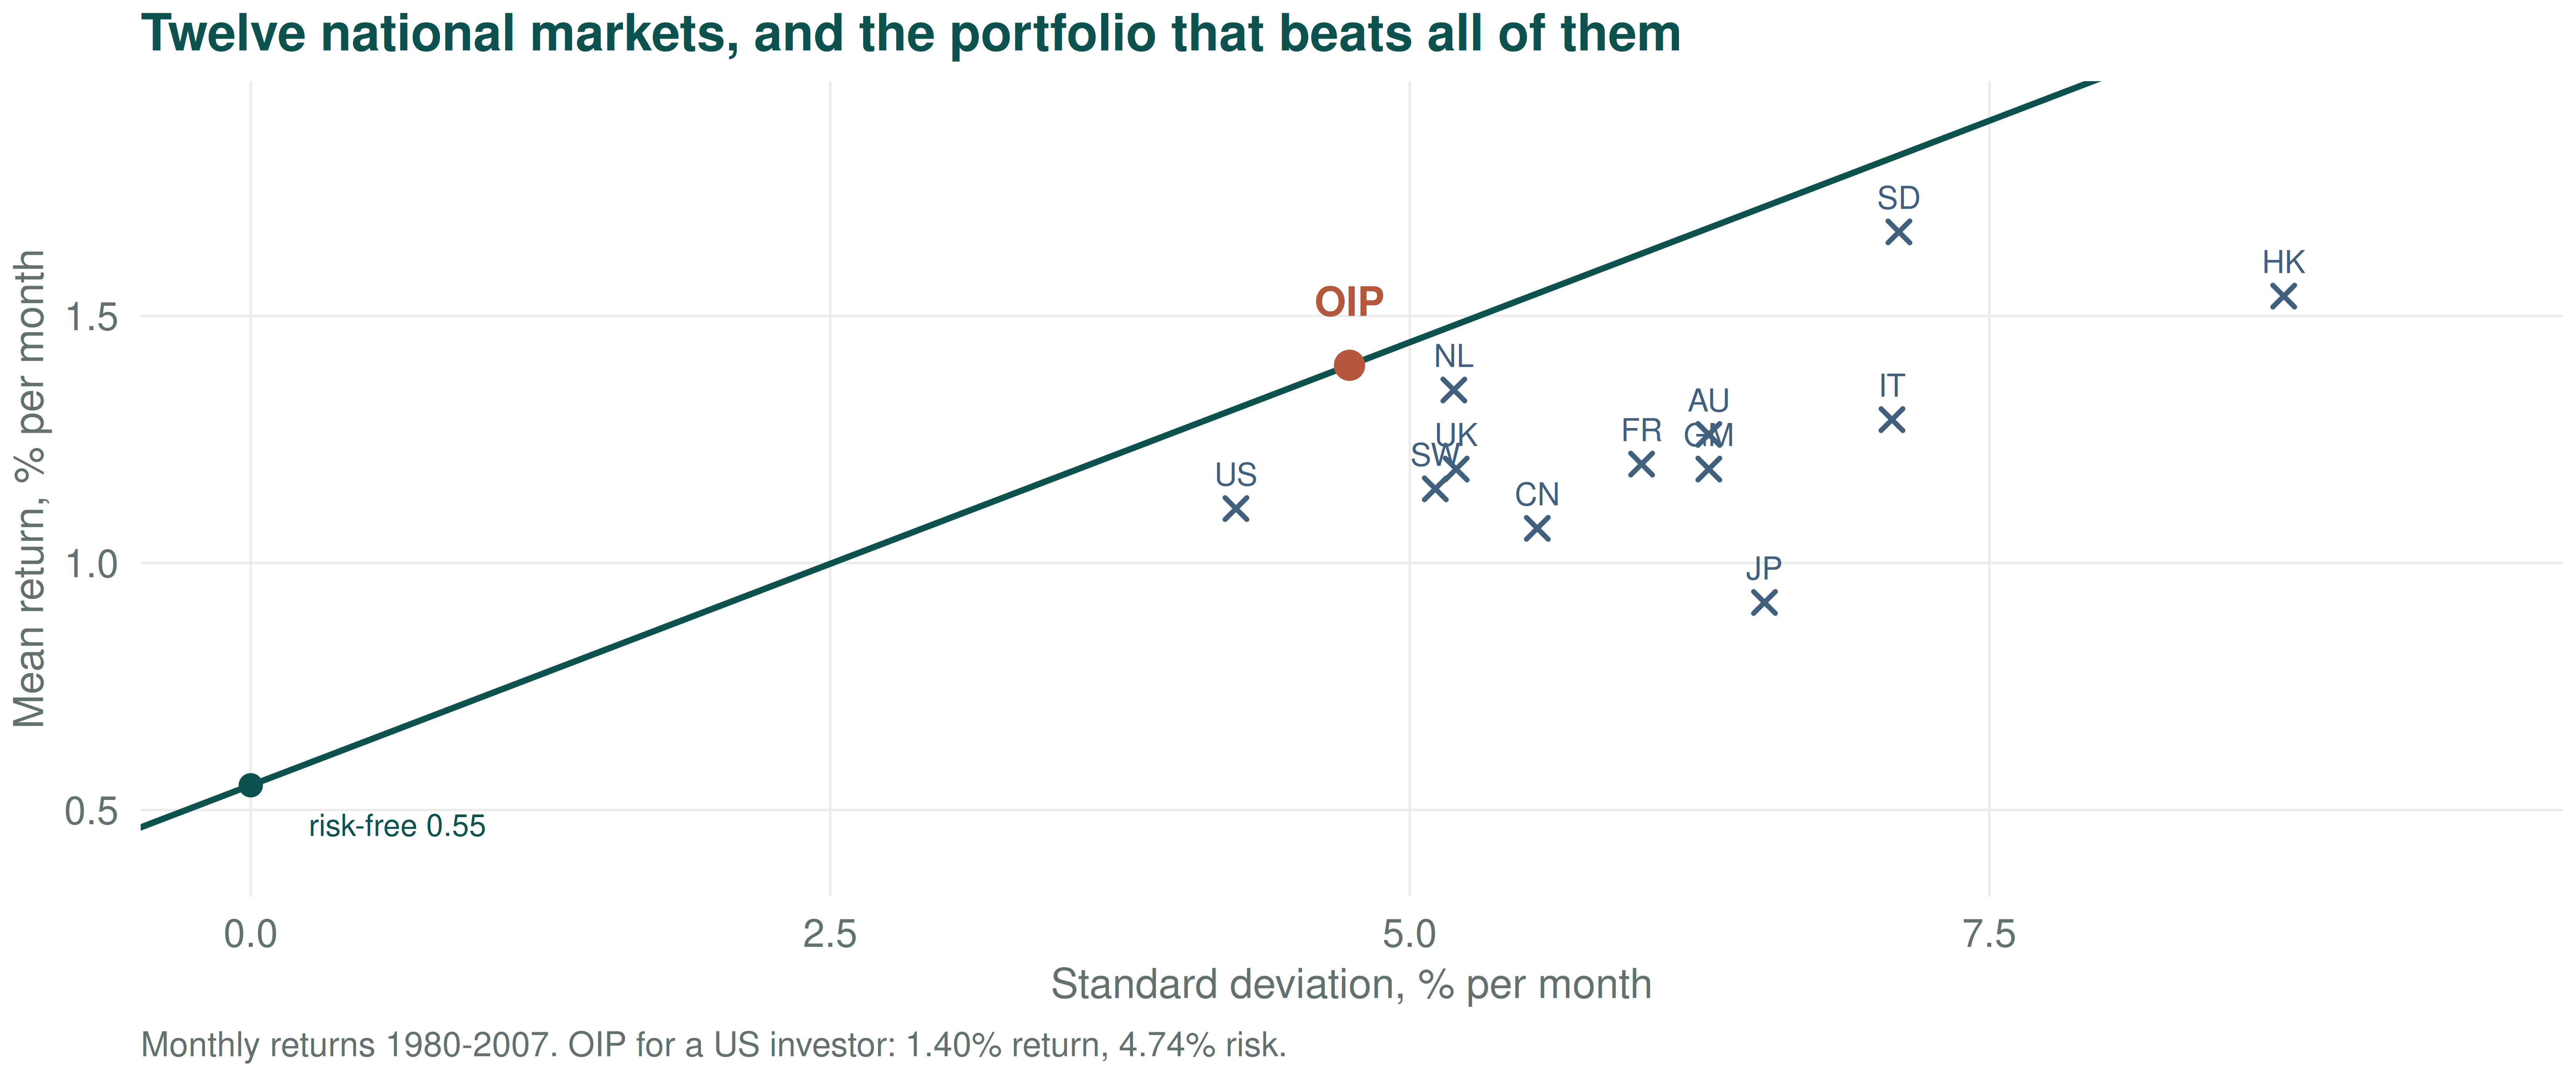
Over 1980–2007, a US investor holding only US stocks earned 1.11% a month with a standard deviation of 4.25. The same investor, holding the optimal international portfolio, earned 1.40% with a standard deviation of 4.74.
- More return and more risk — so the comparison needs a measure that handles both at once.
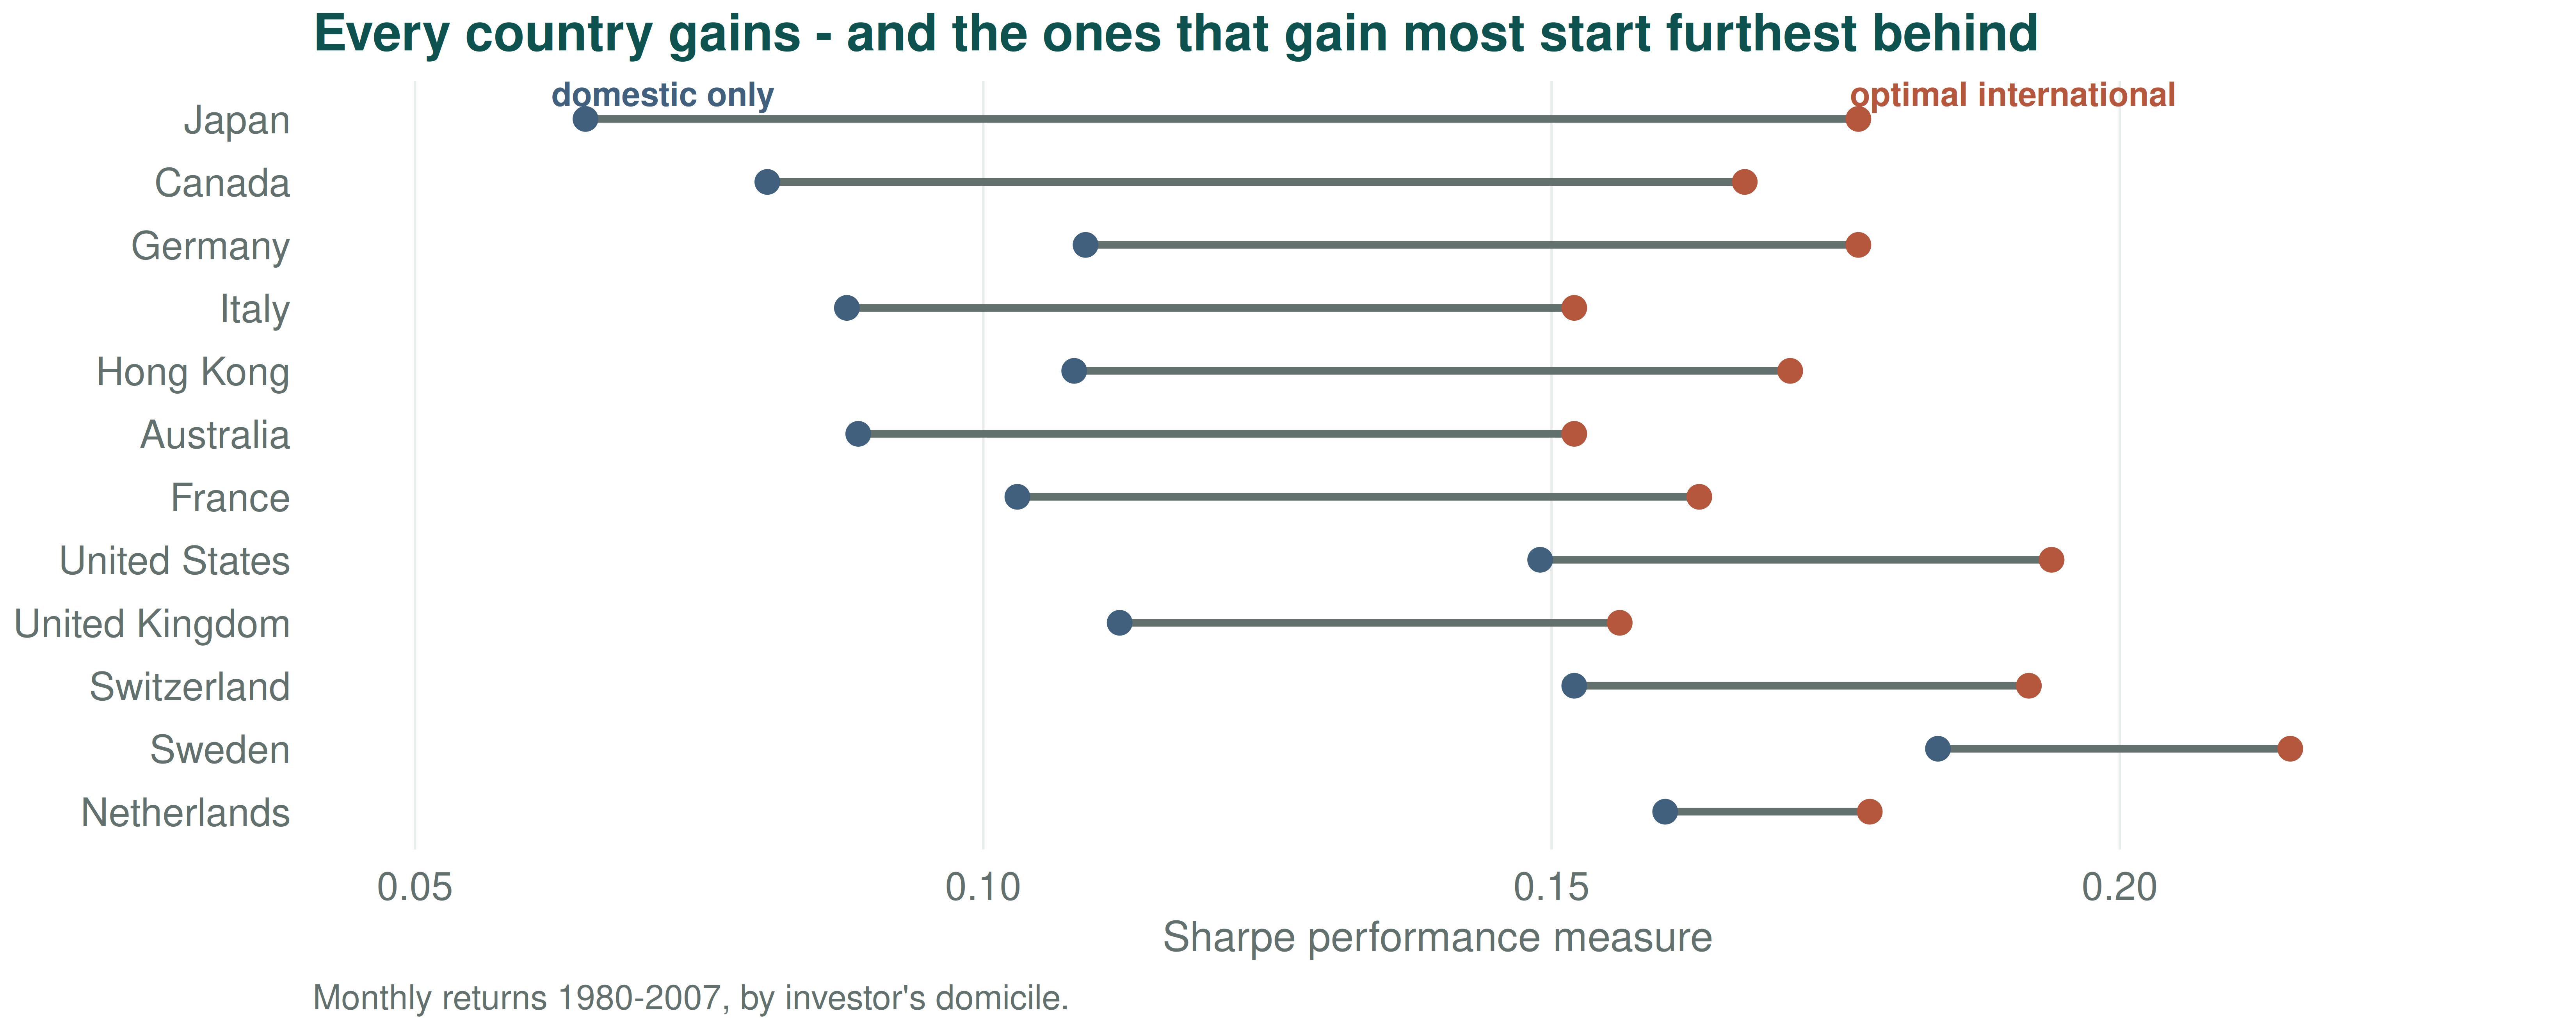
- Adjusted for risk, the international portfolio wins in every one of the twelve countries studied.
- Today is about why that gain exists, how large it is, and what stops investors from taking it.
Where we are
Sessions 3 and 4 went through the instruments. We now turn to the institutions that hold them, and the first question is how anyone should hold a portfolio at all.
Today:
- International portfolio investment — risk reduction, the optimal portfolio, exchange-rate effects and the limits
Next session:
- Mutual funds · 3. Muñoz (2020) · 4. Insurance · 5. Investment firms ·
- Bank management · 7. Economic efficiency
One question runs through all of it: why does an intermediary exist at all? Everything an institution does, an investor could in principle do alone — so each institution has to earn its place.
1 · International portfolio investment
1 · Why diversification works
Portfolio risk falls as you add securities, but only because their returns do not move together. Correlation, not the number of holdings, does the work.
Average correlation of monthly stock returns, within a country (on the diagonal) and between countries:
| AU | FR | DE | JP | NL | CH | UK | US | |
|---|---|---|---|---|---|---|---|---|
| Australia | 0.586 | |||||||
| France | 0.286 | 0.576 | ||||||
| Germany | 0.183 | 0.312 | 0.653 | |||||
| Japan | 0.152 | 0.238 | 0.300 | 0.416 | ||||
| Netherlands | 0.241 | 0.344 | 0.509 | 0.282 | 0.624 | |||
| Switzerland | 0.358 | 0.368 | 0.475 | 0.281 | 0.517 | 0.664 | ||
| United Kingdom | 0.315 | 0.378 | 0.299 | 0.209 | 0.393 | 0.431 | 0.698 | |
| United States | 0.304 | 0.225 | 0.170 | 0.137 | 0.271 | 0.272 | 0.279 | 0.439 |
1 · How far risk falls
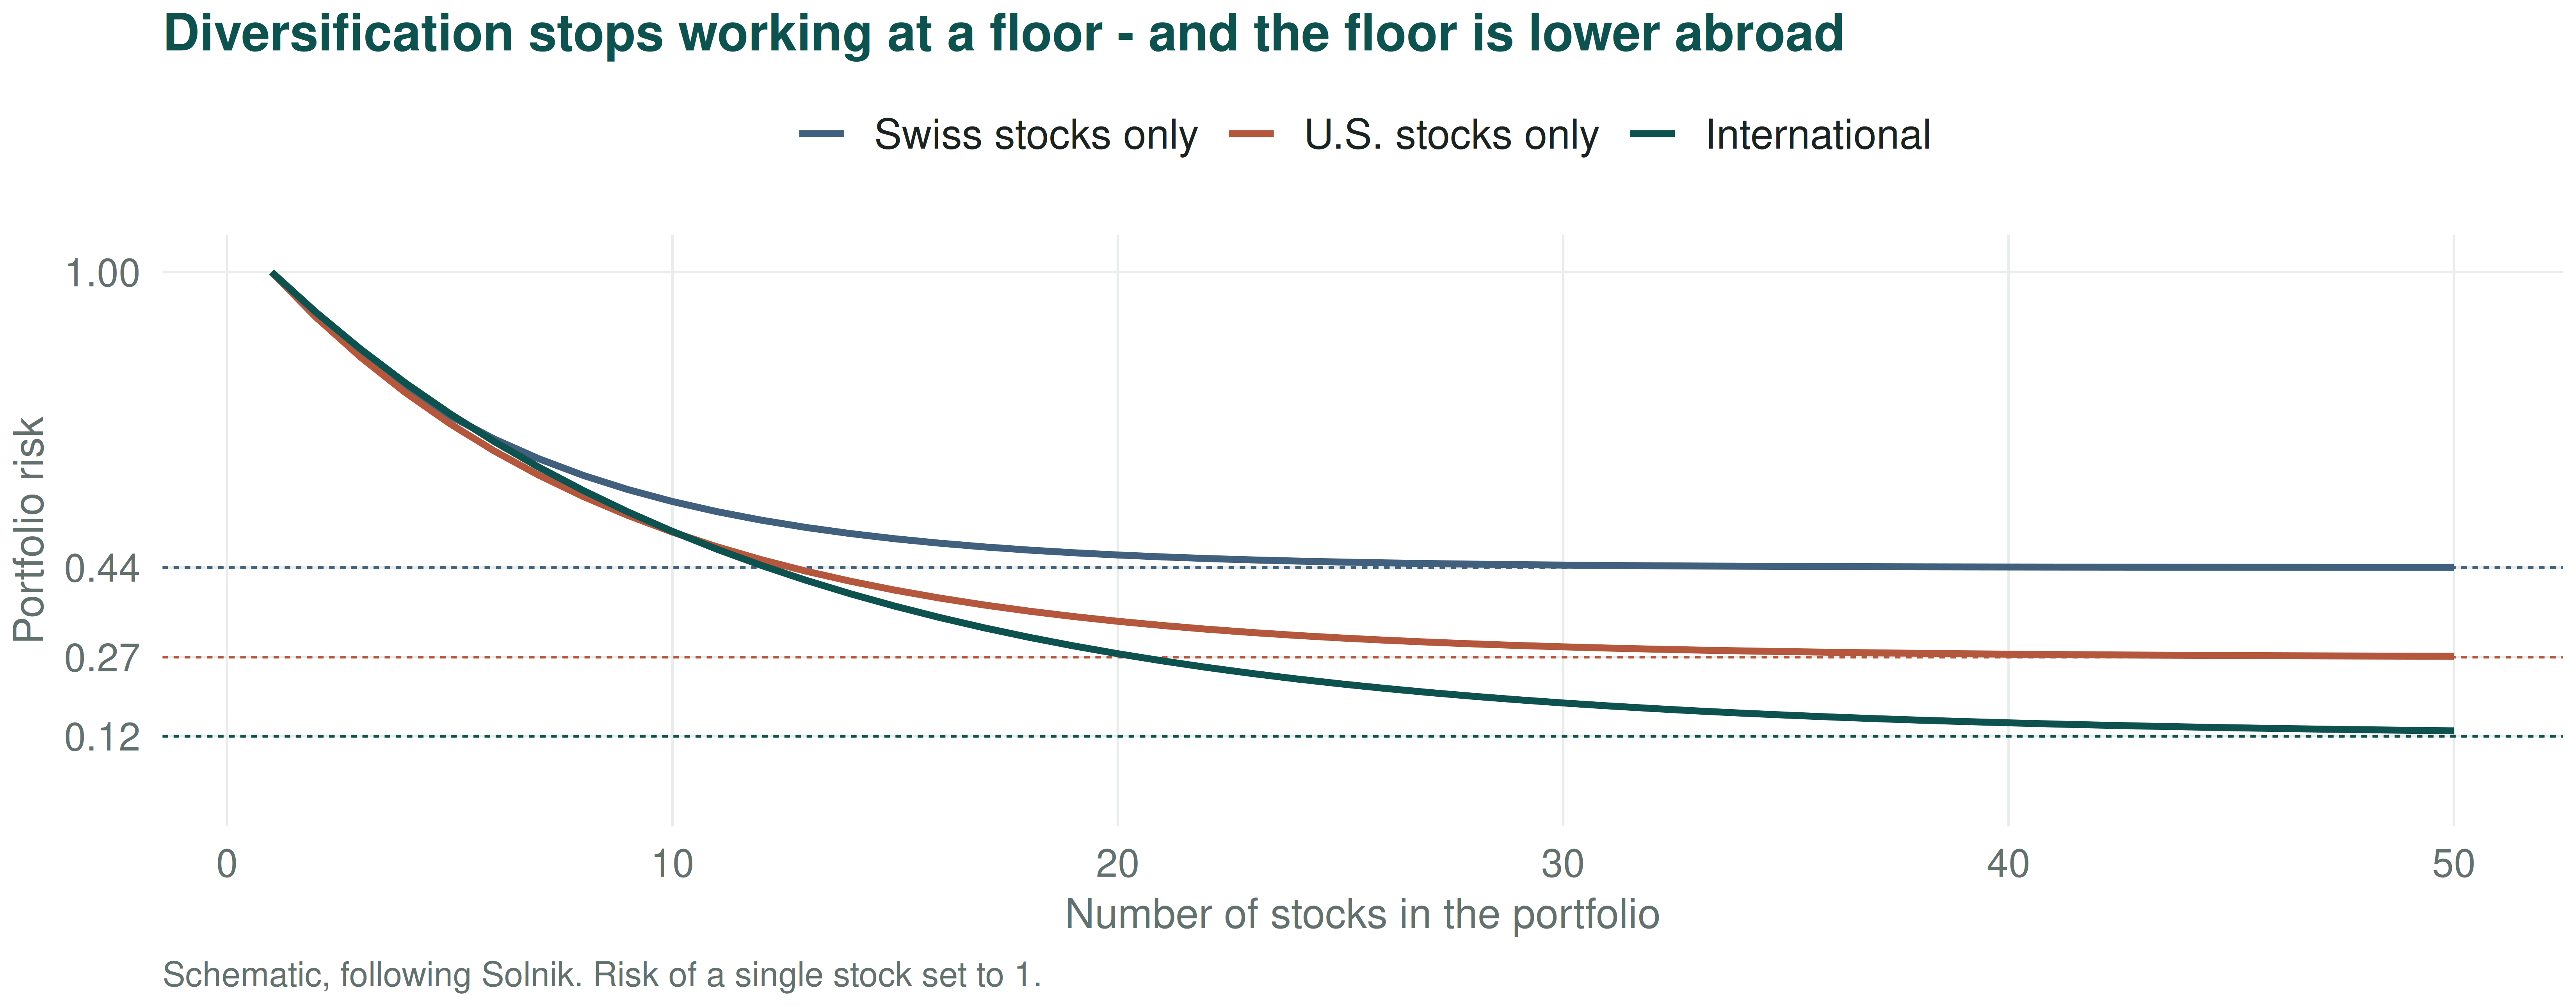
Keep adding stocks and risk falls — but only to a floor. What remains is systematic risk: the part no amount of diversification removes.
1 · Measuring performance
The world beta measures how sensitive a national market is to world market movements — the systematic part, which diversification cannot remove.
The Sharpe performance measure puts return and risk in one number: excess return per unit of total risk.
SHP_i = \frac{\bar R_i - R_f}{\sigma_i}
- \bar R_i — mean return of market i
- \sigma_i — standard deviation of those returns
- R_f — the risk-free rate (US Treasury bill)
Monthly, 1980–2007:
| Market | Mean | SD | β | SHP |
|---|---|---|---|---|
| Sweden | 1.67 | 7.11 | 1.17 | 0.168 |
| Netherlands | 1.35 | 5.19 | 0.99 | 0.167 |
| United States | 1.11 | 4.25 | 0.88 | 0.149 |
| Hong Kong | 1.54 | 8.77 | 1.06 | 0.121 |
| France | 1.20 | 6.00 | 1.04 | 0.121 |
| Japan | 0.92 | 6.53 | 1.10 | 0.067 |
1 · The optimal portfolio
Investors prefer more wealth to less and dislike risk. With a risk-free asset available, the best portfolio of risky assets is the one that maximises the Sharpe ratio:
\max (SHP_{op}) = \frac{\bar R_{op} - R_f}{\sigma_{op}}
With two risky assets A and B:
\bar R_{op} = x_A \bar R_A + x_B \bar R_B
\sigma_{op} = \left[x_A^2\sigma_A^2 + x_B^2\sigma_B^2 + 2x_Ax_B\sigma_{AB}\right]^{1/2}
Substituting and maximising with respect to the weights gives
x_A = \frac{(\bar R_A - R_f)\sigma_B^2 - (\bar R_B - R_f)\sigma_{AB}} {(\bar R_A - R_f)\sigma_B^2 + (\bar R_B - R_f)\sigma_A^2 - (\bar R_A - R_f + \bar R_B - R_f)\sigma_{AB}}
x_B = 1 - x_A
1 · Problem 5.1
For 1980.1–2001.12, monthly, in percent, for the US and Netherlands indexes:
\bar R_{US} = 1.26, \sigma^2_{US} = 19.62 · \bar R_{NL} = 1.38, \sigma^2_{NL} = 26.52 · R_f = 0.55 · \sigma_{US,NL} = 14.14
- What is the optimal international portfolio?
- What are its expected return and risk?
- What is its Sharpe performance?
- How does that compare with the US alone?
1 · The efficient set, drawn
1 · What the optimal portfolio holds
For a US investor, the optimal international portfolio over 1980–2007:
| Market | Weight |
|---|---|
| Netherlands | 31.11% |
| Sweden | 28.01% |
| United States | 20.70% |
| Hong Kong | 8.76% |
| Italy | 6.60% |
| Australia | 4.82% |
| Total | 100% |
Three things to notice:
- Only six of the twelve markets appear at all. The others add nothing once these are held.
- The investor’s own market is a fifth of the portfolio, not the whole of it.
- The weights are not proportional to market size. Sweden is a small market with a large weight, because its returns were high and only loosely correlated with the rest.
The composition differs by the investor’s domicile, because each investor’s home market is already in their portfolio.
1 · The size of the gain
1 · The exchange rate comes with it
A US resident investing abroad earns the foreign return and whatever the currency does:
R_{i\$} = R_i + e_i + R_i e_i \qquad \text{since} \qquad 1 + R_{i\$} = (1+R_i)(1+e_i)
where R_i is the local-currency return and e_i the change in the exchange rate — positive when the foreign currency appreciates against the dollar.
The currency affects risk through three separate channels:
Var(R_{i\$}) = Var(R_i) + Var(e_i) + 2\,Cov(R_i, e_i) + \Delta Var
its own volatility, its covariance with the local market, and the cross-product term.
1 · Problem 5.2
A US resident has just sold shares in a British firm. The shares returned 15% in pounds, over a period in which the pound depreciated 5% against the dollar.
What is the dollar return, in percentage terms?
1 · Other ways to get there
International bonds. Less studied than equities, and exchange risk makes the gains hard to realise — though currency forwards can hedge most of it away.
International mutual funds. Diversification bought at home: no extra transaction or information costs, no legal barriers, and professional managers.
Country funds. Invest in a single foreign market — useful for building your own allocation, or for reaching markets otherwise closed.
ADRs. Foreign shares repackaged to trade on a US exchange, in dollars.
ETFs. Track a foreign index and trade like a single stock.
Hedge funds. Privately pooled, aggressive and flexible — leverage, short positions, derivatives, across currencies, bonds, stocks, commodities and property. Sought for absolute returns, whether markets rise or fall, with the risk that entails.
1 · Problem 5.3
US-based international mutual funds, against the S&P 500 and the US MNC index, monthly over 1977–1986:
| Mean return | SD | \beta_{US} | |
|---|---|---|---|
| US-based international mutual funds | 1.58 | 5.78 | 0.69 |
| S&P 500 | 1.17 | 4.25 | 1.00 |
| US MNC index | 1.34 | 4.38 | 0.98 |
What is your analysis of their relative performance?
The US MNC index holds the 60 US multinationals with the highest share of international revenue.
1 · Why almost nobody does it
Home bias. Investors hold far more domestic equity than any model recommends. Four explanations are offered:
- Domestic securities provide services foreign ones do not, such as hedging domestic inflation.
- Barriers, formal and informal — legal, administrative, transaction and information costs, taxes.
- The prudent man rule: institutions may simply be forbidden to hold more than a set fraction abroad.
- It may be fading, as markets integrate and country funds and international mutual funds spread.
Large-cap bias. Portfolios that do go abroad concentrate in large firms — and large firms are the worst vehicle for the job.
- Large caps are typically multinationals, with foreign customers and investors, so their returns are driven by common global factors and are highly correlated.
- Small-cap firms are driven by local factors, so they are the more effective instrument for international diversification.
Next session
Session 6 continues the chapter: mutual funds, the Muñoz (2020) reading, insurance companies, investment firms, bank management and economic efficiency.
Read Muñoz (2020) on the boards of socially responsible mutual funds before the session. The discussion is assessed.
Press O for the slide overview · C to draw · S for speaker notes · F for fullscreen · E then print for a PDF of the slides.
International Finance · Session 5 · KEDGE